Transcription of Highlights Wind Vision - Energy
1 Wind Vision :A New Era for Wind Power in the United StatesHighlightsWind Vision : A New Era for Wind Power in the United StatesWind Vision Objectives The Department of Energy s (DOE s) Wind and Water Power Technologies Office has conducted a comprehensive analysis to evaluate future pathways for the wind industry. Through a broad-based collaborative effort, the Wind Vision analysis includes four principal objectives:1. Documentation of the current state of wind power in the United States and identification of key technological and societal accomplishments over the decade leading up to 2014;2. Exploration of the potential pathways for wind power to contribute to the future electricity needs of the nation, including objectives such as reduced carbon emissions, improved air quality, and reduced water use;3.
2 Quantification of costs, benefits, and other impacts associated with continued deployment and growth of wind power; and4. Identification of actions and future achievements that could support continued growth in the use and application of wind-generated Wind Vision analysis results from a collaboration of the DOE with over 250 experts from industry, electric power system operators, environmental stewardship organizations, state and federal governmental agencies, research institutions and laboratories, and siting and permitting stakeholder groups. The conclusions of this effort, summarized below, demonstrate the role that wind power has in the power sector today and Highlights its potential to continue to provide clean, reliable, and affordable electricity to consumers for decades to come.
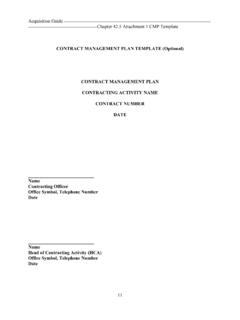
3 The Wind Vision report does not evaluate nor recommend policy actions, but analyzes feasibility, costs, and benefits of increased wind power deployment to inform generally, as well as to provide insights for policy decisions at the federal, state, tribal, and local levels. Wind Power TodayWind power has become a mainstream power source in the electricity portfolio, supplying of the nation s electricity demand in 2013. With more than 61 gigawatts (GW) installed across 39 states at the end of 2013, utility-scale wind power is a cost-effective source of low-emissions power generation throughout much of the nation. From 2008 to 2013, wind power installations expanded in geographic deployment and cumulative capacity (Figure 1), with corresponding growth in the domestic supply chain. Wind power costs have declined by more than one-third since 2008, and the manufacturing base has expanded to support annual deployment level growth from 2 GW/year in 2006, to 8 GW/year in 2008, to peak installations of 13 GW/year in 2012.
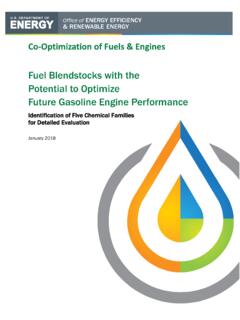
4 In the United States, new investments in wind plants averaged $13 billion/year from 2008 through 2013. Global investment in wind power grew from $14 billion in 2004 to $80 billion in 2013, a compound annual growth rate of 21%. Wind deployment delivers public health and environmental benefits today, including reduced greenhouse gas (GHG) emissions, reduced air pollutants, and reduced water consumption and Deployment of wind technology for electricity generation provides a domestic, sustainable, and essentially zero-carbon, zero-pollution, and zero-water use electricity The power sector is the largest contributor to GHG emissions and a major source of criteria air pollutants such as sulfur dioxide (SO2) and nitrogen oxides (NOX). Wind power is already reducing these emissions from the electric power sector (Figure 2).
5 Analysis of wind installation and operational experience as of 2013 concludes that: The wind industry, including associated manufacturing and installation activities, has demonstrated the ability to scale to satisfy rapid build demands; Wind generation variability has a minimal and manageable impact on grid reliability and related costs; and Environmental and competing use challenges for local communities, including land use, wildlife concerns, and radar interference issues, can be effectively managed with appropriate planning, technology, and communication among stakeholders. Through 20082009 through 2013 Total Wind DeploymentNote: Distributed wind projects with less than 1 MW have been installed in all 50 5 States in 2013by total capacity (GW) 2013, cumulative utility-scale wind deployment reached 61 GW across 39 states.
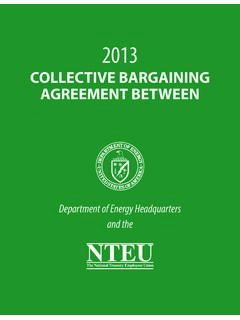
6 603015 Total Capacity (GW)5 1 Figure 1. Utility-scale wind deployment through 20133 The Wind Vision Study ScenarioThe Wind Vision analysis updates and expands upon the DOE s 2008 report, 20% Wind Energy by 2030,1 through analysis of a Study Scenario of wind power supplying 10% of national end-use electricity demand by 2020, 20% by 2030, and 35% by 2050 (Figure 3). This Study Scenario provides a framework for conducting detailed quantitative impact analyses. The Study Scenario starts with current manufacturing capacity (estimated at 8-10 GW of nacelle assembly and other large turbine components within the today) and applies central projections for variables such as wind power costs, fossil fuel costs, and Energy demand in order to arrive at a credible projected pathway that would maintain the existing industry, for purposes of calculating potential social and economic Wind Vision additionally modeled Baseline and Business-as-Usual (BAU) Scenarios.
7 All scenario modeling efforts relied on current and projected data from the Energy Information Administration s Annual Energy Outlook 20142 and the broader literature. The Baseline Scenario kept wind deployment fixed at year-end 2013 levels of 61 GW. It was used as the study s analytical reference case to support comparisons of costs, benefits, and other impacts. BAU conditions represented a future scenario with federal and state policies as enacted as of January 1, 2014. This analytical framework for the Wind Vision study is summarized in Table Penetration(% of Electricity Demand)O shoreLand-based0%10%20%30%40%20502040203 02020201010% by 202020% by 203035% by 2050 Figure 3. The Wind Vision Study Scenario, with contributions from land-based and offshore technologyWind generation in 2013 provided a range of environmental : Emissions and water savings calculated using the EPA s Avoided Emissions and Generation Tool (AVERT).
8 Uncontrolled coal plants are those with no emissions control Dioxidereduced by 115,000,000metric tonnesEquivalent to CO2 emissions from 270 millionbarrels of oilCO2 Sulfur Dioxidereduced by 157,000metric tonnesSO2 Nitrous Oxidereduced by 97,000metric tonnesWater Consumptionreduced by billiongallonsNOXH2 OEquivalent to annual emissions of 12 uncontrolled coal plants Equivalent to annual emissions of 10 uncontrolled coal plants Equivalent to116 gallons/person in the 2. Estimated emissions and water savings resulting from wind generation in 20131 Vision : A New Era For Wind Power in the United States Analytical Framework of the Wind VisionWind Vision Study ScenarioThe Wind Vision Study Scenario, or Study Scenario, applies a scenario of 10% of the nation s end-use demand served by wind by 2020, 20% by 2030, and 35% by 2050.
9 It is the primary analysis scenario for which costs, benefits, and other impacts are assessed. The Study Scenario comprises a range of cases spanning plausible variations from central values of wind power and fossil fuel costs. The specific Study Scenario case based on those central values is called the Central Study ScenarioThe Baseline Scenario applies a constraint of no additional wind capacity after 2013 (wind capacity fixed at 61 GW through 2050). It is the primary reference case to support comparisons of costs, benefits, and other impacts against the Study ScenarioThe Business-as-Usual (BAU) Scenario does not predetermine a wind future trajectory, but instead models wind deployment under policy conditions current on January 1, 2014. The BAU Scenario uses demand and cost inputs from the Energy Information Administration s Annual Energy Outlook 1.
10 Analytical Framework of the Wind VisionStudy ScenarioBAU ScenarioLow Wind Costs High Fossil Fuel CostsLow Wind Costs and High Fossil Fuel CostsBaseline ScenarioWInd Energy (TWh/year)2050204020302020201005001,0001 ,5002,0002,5003,00010% WindPenetration20% WindPenetration35% WindPenetrationThe Study Scenario falls within the range of economic sensitivities around the BAU : Under BAU conditions, wind deployment is stagnant until 2030. Conditions of low wind power costs and/or high fossil fuel costs, however, can accelerate deployment growth and result in outcomes on the order of 10% wind by 2020, 20% wind by 2030, and 35% wind by 2050. Low wind power costs start at median 2013 costs and then decline 24% by 2020, 33% by 2030, and 37% by 2050. High fuel costs use the Low Oil and Gas Resource and High Coal Cost Case from Annual Energy Outlook, 4.