Transcription of Housing Affordability Monitor - 2021Q3 - NBC
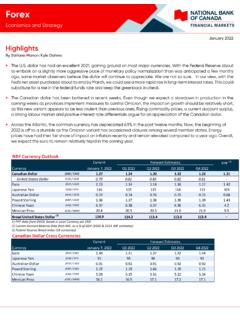
1 Economics and Strategy Housing Affordability MonitorFebruary 28, 2022 Housing Affordability deteriorated in every quarter of 2021By Kyle Dahms & Alexandra DucharmeHousing Affordability in Canada worsened by points in Q4 21, marking a fourth consecutive quarterly deterioration. Over the past year, Affordability has worsened at the fastest pace in more than 26 years. As a result, it would take of income for a representative household to service the mortgage on a representative home in Canada (see chart on the left). This level is a bit more than the last cyclical high seen in 2018Q4 and marks the worst Affordability since the mid-90`s with Toronto, Hamilton, Ottawa and Halifax showing levels not seen since the start of this century. While home price growth had its fair share in contributing to declining Affordability in Q4, the larger driver was rising mortgage interest rates.
2 Our 5-year benchmark mortgage rate used by our Affordability metrics rose 28bps in the last quarter of the year which was the largest one quarter change since 2017Q3 when the central bank raised the overnight rate twice in the same quarter. With investors now anticipating a more rapid increase in policy rates, our benchmark rate has increased by another 30 bps in the current quarter for a cumulative 100 bps since the 2020Q4 rate trough. All else being equal, such an increase would have translated into a decline in purchasing power. However, homebuyers opted for variable rate mortgages in a record high proportion (53%) in the second half of 2021. By selecting this option instead of the typical 5-year fixed mortgage, mortgage holders increased their purchasing power by 10% in the fourth quarter. But this escape route is about to vanish in the coming months with the Bank of Canada policy rate on the rise (we expect a 125 basis points increase in 12-months).
3 HIGHLIGHTS: Canadian Housing Affordability deteriorated for a fourth consecutive quarter in Q4`21. The mortgage payment on a representative home as a percentage of income (MPPI) rose points after a increase in Q3 21. Seasonally adjusted home prices increased in Q4 21 from Q3 21; the benchmark mortgage rate (5-year term) rose 28bps, while median household income rose Affordability deteriorated in all the ten markets covered in Q4. On a sliding scale of markets from worst deterioration to least: Victoria, Toronto, Hamilton, Vancouver, Montreal, Qu bec, Calgary, Edmonton, Winnipeg, Ottawa-Gatineau (see chart on the right). This was the fourth consecutive quarter with a worsening in all markets. Countrywide, Affordability deteriorated pp in the condo portion vs. a pp deterioration in the non-condo segment. See detailed statistics on page 12.
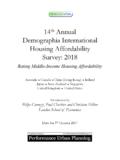
4 &RPSRVLWH RI PHGLDQ LQFRPH1%) (FRQRPLFV DQG 6 WUDWHJ\ GDWD YLD 6 WDWLVWLFV &DQDGD 7 HUDQHW 1 DWLRQDO %DQN &RQGR1RQ FRQGR&DQDGD 3 HUVSHFWLYH RQ KRXVLQJ DIIRUGDELOLW\0 RQWKO\ PRUWJDJH SD\PHQW RQ PHGLDQ KRPH SULFH \HDU DPRUWL]DWLRQ \HDU WHUP 277 *$7:,1 ('0 &$/ 48( 07/ &$1 9$1 +$0 725 9,&,QWHUHVW UDWH+RPH SULFH,QFRPH7 RWDO&DQDGD 4 FKDQJH LQ KRXVLQJ DIIRUGDELOLW\ LQ PHWURSROLWDQ DUHDV4 4 FKDQJH LQ PRUWJDJH SD\PHQW RQ PHGLDQ SULFH KRPH \HDU DPRUWL]DWLRQ \HDU WHUP 1%) (FRQRPLFV DQG 6 WUDWHJ\ GDWD YLD 6 WDWLVWLFV &DQDGD 7 HUDQHW 1%& 3 HUFHQWDJH SRLQWV RI PHGLDQ LQFRPHD eteriorationImprovementS+ payment as a % of income (MPPI)+Non-Condo$1,234,597 Price of the representative home in the metropolitan market$212,013 Household annual income needed to afford the representative homePrice of the representative condo in the metropolitan market$682,111$137,145 Household annual income needed to afford the representative condoTorontoIn Toronto, the final quarter of 2021 was marked by a sharp decline in Housing Affordability .))
5 The MPPI* increased pp in thequarter to , its highest level since 1990. This deterioration was observable in both dwelling segments (MPPI* edged up + for condos and + pp for non-condos). This deterioration was inpart attributable to higher home prices, which rose forthe tenth consecutive quarter (+ ), while income rose Both condo prices and non-condo prices jumped in the quarter(+ and + , respectively). For all types of dwellings,the price increases exceededthe respective urban compositeaverage. On an annual basis, home prices in Toronto edged up , surpassing the index s mean increase of Anincrease in interest rates also contributed to worsen Affordability . Monthly mortgage payments amounted for of themedian pre-tax household income, which was far greater thanthe average for the period since 2000 ( ) and the averagefor the composite index ( ).
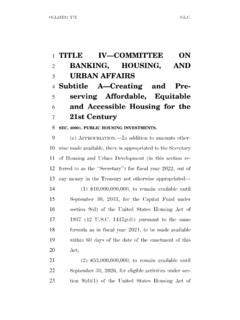
6 *See tables page for buying compared to renting a two-bedroom condo in the GTA59 Months of saving required for the down payment (saving rate of 10%)Premium for buying compared to the national urban of saving required for the down payment (saving rate of 10%) 1%) (FRQRPLFV DQG 6 WUDWHJ\ GDWD YLD 6 WDWLVWLFV &DQDGD 7 HUDQHW 1 DWLRQDO %DQN 6 SUHDG 6 SUHDG O $YHUDJH VSUHDG0 RQWKO\ PRUWJDJH SD\PHQW RQ D PHGLDQ SULFHG FRQGR U $YHUDJH PRQWKO\ UHQW U 7 RURQWR %X\LQJ FRPSDUHG WR UHQWLQJ3 UHPLXP GLVFRXQW IRU EX\LQJ FRPSDUHG WR UHQWLQJ D WZR EHGURRP FRQGR 7 RURQWR 3 HUVSHFWLYH RQ KRXVLQJ DIIRUGDELOLW\0 RQWKO\ PRUWJDJH SD\PHQW RQ PHGLDQ KRPH SULFH \HDU DPRUWL]DWLRQ \HDU WHUP &RPSRVLWH RI PHGLDQ LQFRPH1%) (FRQRPLFV DQG 6 WUDWHJ\ GDWD YLD 6 WDWLVWLFV &DQDGD 7 HUDQHW 1 DWLRQDO %DQN &RQGR1RQ FRQGRTORONTONon-CondoCondoS+ the final quarter of 2021, the Affordability of the Housing market in Montreal deteriorated for the fifth consecutive quarter toreach its worst level since 2008.
7 The deterioration stemmed from both condos and non-condos (MPPI* edged up pp and respectively), although the increases were all less than the composite average. On an annual basis, home prices inMontreal were up , a deceleration from the previous quarter but still very high on a historical basis and above the urbancomposite (+ ). This, combined to higher interest rates, resulted in the fastest annual deterioration in Affordability since1995 (MPPI* up pp), although this was still less than the urban composite (MPPI* up pp in 12 months). All in all, despiteimportant deteriorations, the Montreal Housing market remains more affordable than the Canadian average thanks to lowerprice levels. *See tables page payment as a % of income (MPPI) + $370,392$75, of the representative condo in the metropolitan marketHousehold annual income needed to afford the representative condoMonths of saving required for the down payment (saving rate of 10%)Premium/discount for buying compared to renting a two-bedroom condo in MontrealPremium for buying compared to the national urban composite$535,034$108, of the representative home in the metropolitan marketHousehold annual income needed to afford the representative homeMonths of saving required for the down payment (saving rate of 10%) 1%)
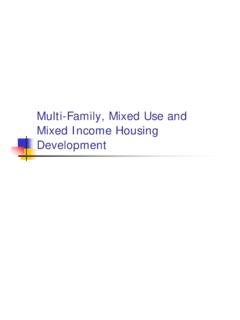
8 (FRQRPLFV DQG 6 WUDWHJ\ GDWD YLD 6 WDWLVWLFV &DQDGD 7 HUDQHW 1 DWLRQDO %DQN 6 SUHDG 6 SUHDG O $YHUDJH VSUHDG0 RQWKO\ PRUWJDJH SD\PHQW RQ D PHGLDQ SULFHG FRQGR U $YHUDJH PRQWKO\ UHQW U 0 RQWUHDO %X\LQJ FRPSDUHG WR UHQWLQJ3 UHPLXP GLVFRXQW IRU EX\LQJ FRPSDUHG WR UHQWLQJ D WZR EHGURRP FRQGR 0 RQWUHDO 3 HUVSHFWLYH RQ KRXVLQJ DIIRUGDELOLW\0 RQWKO\ PRUWJDJH SD\PHQW RQ PHGLDQ KRPH SULFH \HDU DPRUWL]DWLRQ \HDU WHUP &RPSRVLWH RI PHGLDQ LQFRPH1%) (FRQRPLFV DQG 6 WUDWHJ\ GDWD YLD 6 WDWLVWLFV &DQDGD 7 HUDQHW 1 DWLRQDO %DQN &RQGR1RQ FRQGRMONTREALNon-CondoCondoCondoS+ the first three quarters of the year, the final quarter of 2021 was marked by a deterioration in Vancouver's housingaffordability. Home prices increasing from already high levels and rising interest rates could not be offset by a in income. The MPPI* deteriorated + pp on a quarterly basis, keeping Vancouver as the least affordable city among Canada's urban markets.)
9 A mortgage payment now requires of the median income, a 10-quarter high. The deteriorationin Affordability in Vancouver was slightly above the national average both for condos (+ pp) and non-condos (+ pp). On a12-month basis, home prices in Vancouver were up , below the urban composite. Still, elevated price levels and anincrease in interest rates contributed to deteriorate the MPPI* pp in a year, above the national average and the highestannual deterioration since the second quarter of 2018. *See tables page payment as a % of income (MPPI) + $683,650$137, of the representative condo in the metropolitan marketHousehold annual income needed to afford the representative condoMonths of saving required for the down payment (saving rate of 10%)Premium/discount for buying compared to renting a two-bedroom condo in VancouverPremium for buying compared to the national urban composite$1,572,237$269, of the representative home in the metropolitan marketHousehold annual income needed to afford the representative homeMonths of saving required for the down payment (saving rate of 10%) 1%)
10 (FRQRPLFV DQG 6 WUDWHJ\ GDWD YLD 6 WDWLVWLFV &DQDGD 7 HUDQHW 1 DWLRQDO %DQN 6 SUHDG 6 SUHDG O $YHUDJH VSUHDG0 RQWKO\ PRUWJDJH SD\PHQW RQ D PHGLDQ SULFHG FRQGR U $YHUDJH PRQWKO\ UHQW U 9 DQFRXYHU %X\LQJ FRPSDUHG WR UHQWLQJ3 UHPLXP GLVFRXQW IRU EX\LQJ FRPSDUHG WR UHQWLQJ D WZR EHGURRP FRQGR 9 DQFRXYHU 3 HUVSHFWLYH RQ KRXVLQJ DIIRUGDELOLW\0 RQWKO\ PRUWJDJH SD\PHQW RQ PHGLDQ KRPH SULFH \HDU DPRUWL]DWLRQ \HDU WHUP &RPSRVLWH RI PHGLDQ LQFRPH1%) (FRQRPLFV DQG 6 WUDWHJ\ GDWD YLD 6 WDWLVWLFV &DQDGD 7 HUDQHW 1 DWLRQDO %DQN &RQGR1RQ FRQGRVANCOUVERNon-CondoCondoCondoS+ Calgary, home prices increased in the quarter, less than half the urban composite price growth (+ ). This,combined with increasing interest rates and a weak increase in median income (+ ), resulted in a ppincrease in the MPPI*. As a result, a mortgage payment now requires of the median income in Calgary, a printstill well below both the average since 2000 for the city ( ) and the urban composite ( ).)