Transcription of HOUSTON ECONOMIC HIGHLIGHTS
1 HOUSTONECONOMICHIGHLIGHTS2017 December 8, 2017 Publication Underwritten by: Table of Contents12 | HOUSTON in Perspective4 | Payroll Employment6 | Unemployment Rate 8 | Goods-Producing and Service-Providing Jobs10 | Employment by Industry12 | Employment Change by Industry14 | Employment Growth in Major Metros16 | Purchasing Managers Index18 | Oil and Natural Gas Prices20 | Drilling Activity and Oil Price22 | Foreign Trade24 | Air Passengers26 | Residential Real Estate28 | Office Market30 | HOUSTON Hotel Data32 | New Car, Truck and SUV Sales34 | Inflation36 | Living Cost Comparison38 | Housing Cost Comparison40 | HOUSTON Region Population42 | Foreign-Born Population44 | Most Populous Metropolitan Areas45 | Most Populous Counties46 | Most Populous Cities47 | The Work Ethic in Houston48 | Gross Area Product Forecast50 | Population and Employment Forecast52 | Top Metro Areas by Gross Domestic ProductHouston ECONOMIC HIGHLIGHTS , a publication of the Greater HOUSTON Partnership.
2 Is designed to impart a brief understanding of the changes in HOUSTON s economy over the past page is devoted to a single ECONOMIC indicator or a few related indicators. In most cases, a key point and a few paragraphs that amplify the data appear on one page, and a table with historical data follows on the HOUSTON Partnership Research | December 20172 HOUSTON in PerspectivePEOPLEThe nine-county HOUSTON Metropolitan Statistical Area (MSA) had a population of 6,772,470 residents as of July 1, 2016, according to estimates by the Census Bureau. If metro HOUSTON were a state, it would have the 16th largest population in the , ahead of Tennessee (6,651,194) but behind Massachusetts (6,811,779).Harris County had a population of 4,589,928 residents as of July 1, 2016, according to estimates by the Census Bureau. If Harris County were a state, it would have the 26th largest population in the , ahead of Kentucky (4,436,974) but behind Louisiana (4,681,666).
3 The city of HOUSTON had a population of 2,303,482 residents as of July 1, 2016, according to estimates by the Census Bureau. If the city were a state, it would rank 36th in popula- tion in the , ahead of New Mexico (2,081,015) but behind Kansas (2,907,289).Among the nation s metropolitan areas, the HOUSTON MSA in 2016 ranked fourth in number of Hispanics (2,490,600), seventh in number of Blacks (1,144,051) and seventh in number of Asians (511,867), according to the Census Bureau s American Community Bureau of ECONOMIC Analysis estimates the HOUSTON MSA Gross Domestic Product (GDP) at $ billion in 16, making it the sixth largest metro economy. If HOUSTON were a state, its GDP would rank 14th, after Michigan ($ billion) and ahead of Washington ($ billion). Metro HOUSTON s GDP slipped percent from $ billion in 15. The HOUSTON region has a gross domestic product greater than 37 states and accounted for 30 percent of Texas the MSA were an independent nation, it would rank as the world s 24th largest economy, behind Sweden ($ billion), and ahead of Poland ($ billion), according to the International Monetary Fund.
4 In 16, the HOUSTON Association of Realtors Multiple Listing Service recorded closings on 91,528 properties (includes single-family homes, townhomes, condos, high rises, etc.), an average of one every six minutes. In 16, HOUSTON MSA automobile dealers sold 299,461 new cars, trucks and SUVs, an average of one every two minutes. In 16, the HOUSTON Airport System handled 54,546,393 passengers, an average of 104 passengers per minute. In 16, the City of HOUSTON issued building permits for construction valued at $ billion, an average of $209 per 201691,528propertyclosings299,461new cars, trucks and SUVs sold54,546,393airportpassengers$ billionin constructionbuilding permitsThe HOUSTON MSA ranks:4th in number of Hispanics7th in number of Asians7th in number of Blacks4,589,928residents inHarris County6,772,470residents inMetro Houston2,303,482residents in thecity of HoustonGreater HOUSTON Partnership Research | December 20173 HOUSTON in PerspectiveAREAThe nine-county HOUSTON -The Woodlands-Sugar Land Metropolitan Statistical Area (MSA) covers 9,444 square miles an area smaller than Maryland but larger than New County covers 1,778 square miles an area nearly half as large as Rhode 655 square miles, the city limits of HOUSTON could contain the cities of New York, Washington, , Boston, San Francisco, Seattle, Minneapolis and FOR THE DATA IN THIS PUBLICATIONM etropolitan statistical areas are geographic delineations defined by the Office of Management and Budget for use by federal statistical agencies in collecting, tabulating and publishing federal statistics.
5 These geographic delin- eations change over time, with the most recent change occurring in March publication contains data based on both of the 2009 and 2013 delineations for the HOUSTON MSA, depending on the source. Where possible, every effort was made to revise data to reflect the new nine-county HOUSTON MSA DELINEATION FOR THE HOUSTON REGION: HOUSTON - Sugar Land - Baytown Metropolitan Statis- tical Area (MSA) contains 10 counties: Austin, Brazoria, Chambers, Fort Bend, Galveston, Harris, Liberty, Montgomery, San Jacinto and MSA DELINEATION FOR THE HOUSTON REGION: HOUSTON - The Woodlands - Sugar Land Metropolitan Statistical Area (MSA) contains nine counties: Austin, Brazoria, Chambers, Fort Bend, Galveston, Harris, Liberty, Montgomery and HOUSTON MSAW allerAustinFort BendBrazoriaHarrisMontgomeryLibertyGalve stonChambers9,444 square miles6,772,470 residents$ billion GDPG reater HOUSTON Partnership Research | December 20174 Payroll EmploymentTotal nonfarm payroll employment in HOUSTON has rebounded from Hurricane Harvey and continues to grow at a moderate HOUSTON metro area reached a record 3,061,600 total nonfarm payroll jobs in October 17, an increase of 48,100 jobs or percent from October 16.
6 After enduring the energy industry s worst downturn in history, HOUSTON s job market entered a period of gradual growth. Through the first half of 17, the region s employ-ment was adding an average of 4,200 jobs a Harvey created a temporary disruption causing a decline of 11,200 jobs in September, primarily in leisure and hospitality. (Note: Although the storm hit the HOUSTON area in August, the event occurred after the August employ-ment data was collected so employment effects related to Harvey are captured in the September data.) HOUSTON began to see modest employment gains starting in 17 as oil prices stabilized between the mid-$40s and low-$50s and the rig count rose from 665 in January 17 to 915 in November 17. HOUSTON s employment remained resilient throughout the energy downturn with only three months of a negative 12-month change in total employment: June, July and August of strong economy, momentum from the previous ECONOMIC boom, strong population growth, and $60 billion in petrochemical plant expansions helped offset losses in upstream energy and.
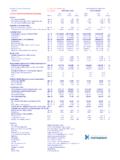
7 Texas Workforce Commission12-month changeTotal payroll employmentNONFARM PAYROLL EMPLOYMENTH ouston MSAN onfarm Payroll Employment (000)12-Month Change (000) - - - - , , , , , , , , , , Greater HOUSTON Partnership Research | December 20175 Payroll EmploymentHOUSTON-THE WOODLANDS-SUGAR LAND METROPOLITAN STATISTICAL AREA (MSA)Nonfarm Payroll Employment, Year-EndYearNonfarm Payroll EmploymentChange from Prior Year20072,645,50091,00020082,666,80021,3 0020092,556,300-110,50020102,606,60050,3 0020112,689,70083,10020122,808,500118,80 020132,898,90090,40020143,017,100118,200 20153,017,30020020163,036,00018,70012-mo nth total ending October 20173,061,60048,100 Source: Texas Workforce CommissionGreater HOUSTON Partnership Research | December 20176 Unemployment Rate HOUSTON s unemployment rate fell to percent in October 17, the lowest for the region since April s unemployment rate was percent in October 17, down from percent in September 17 and percent a year ago.
8 Texas unemployment rate was percent in October, down from percent in September and percent in October 16. The rate was percent in October, down from percent in September and percent in October 16. The rates are not seasonally s unemployment rate remained relatively low through the beginning of the energy downturn, not creeping up until May 15, nearly a year after oil prices plummeted. It reached a high of percent in February 17 but has since trended down. Although the unemployment rate has fallen from its recent peak, the civilian labor force has also shrunk by 31,900 during this s unemployment rate tracked below the rate for nearly a decade from December 06 to early 16. During much of this period, the region s unemployment rate was below the national rate by at least one percentage point. Since April 16, HOUSTON s unemployment rate has tracked above the national rate. Source: Texas Workforce Commission*Rates not seasonally MSA % Civilian Labor Force % % % % % % % % %UNEMPLOYMENT RATE* HOUSTON MSA, Texas and HOUSTON Partnership Research | December 20177 Unemployment RateUNEMPLOYMENT RATE: HOUSTON -THE WOODLANDS-SUGAR LAND MSA, TEXAS AND THE UNITED STATESP ercent of Civilian Labor Force Unemployed*Annual AveragesYearHouston for the 12 months ending October 17 : Texas Workforce Commission*Rates not seasonally adjustedGreater HOUSTON Partnership Research | December 20178 Goods-Producing and Service-Providing JobsHouston s service-providing sector is at record employment with more than million jobs while the goods-producing sector is still struggling to regain jobs lost during the energy industry goods-producing industries (mining and logging, construction, and manufacturing) peaked at 590,200 jobs in December 14 then fell to a low of 519,000 jobs in November 16.
9 The sector enjoyed strong job growth, increasing to its recent peak of 535,500 in June 17. Since then, goods-pro-ducing employment weakened to 529,900 in October goods-producing sector is strongly tied to the rig count which grew from a record low of 404 rigs in May 16 to the most recent peak of 958 in July 16. The rig count has since fallen to 915 in November 17 and industry analysts believe it will hover between 900 and 1,000 with oil prices remaining flat in the mid-$50s and efficiency gains in production. Construction, aided by the petrochemical plant expansions on the eastside of HOUSTON , helped offset some of the goods-producing job losses during the energy downturn. However, as many of the projects have been delivered and few new expansions have been announced, construction employment has declined from a high of 222,600 jobs in October 15 to 213,300 in October 17. The service-providing industries reached 2,531,700 jobs in October 17, a new record for the HOUSTON region.
10 Gains primarily occurred in industries that rely on population growth such as health care and public education. Profes-sional and business services also added jobs driven by growth in employment services. Source: Texas Workforce CommissionGOODS-PRODUCING AND SERVICE-PROVIDING EMPLOYMENTH ouston MSAS ervice-providingGoods-producingGoods-Pro ducing Jobs (000s)Service-Providing Jobs (000s) , , , , , , , , , Greater HOUSTON Partnership Research | December 20179 Goods Producing and Service-Providing JobsHOUSTON-THE WOODLANDS-SUGAR LAND MSAA nnual AveragesYearService-ProvidingGoods-Produ cing2007521,2252,063,8832008536,7172,104 ,1252009491,4922,078,7752010471,9252,094 ,1332011491,0252,142,1752012524,2832,213 ,3752013549,1922,290,9832014573,5002,367 ,2832015566,8832,429,0172016530,3172,470 ,283 Average for the 12 months ending October 17 529,0082,503,467 Source: Texas Workforce CommissionGreater HOUSTON Partnership Research | December 201710 Employment by IndustryNo single industry or sector dominates HOUSTON payroll employment in the HOUSTON metro area reached 3,061,600 in October 17, a record for the region.