Transcription of How$to$Calculate$Mean,$Standard$Deviation$ …
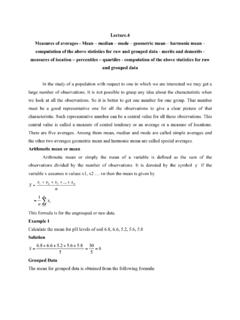
1 How to Calculate Mean, Standard Deviation (SD), Standard Error of the Mean (SEM), and 95% Confidence Interval for a Sample of Values 1. Sample MeanA sample is a collection of measurements or values. The sample mean is the average value in a sample. It is calculated using the following equation: = !!To calculate the sample mean: 1. Sum all the values (x) in a given Divide the sum by the number (n) of values in the sample. = mean x = individual sample values n = number of values in the sample = sum = !!! !!! !!! !!! !!! !!! !!! !!! !!! !!"! = !"!!"!!"!!"!!"!!"!!"!!"!!"!!"!"x 23 27 29 23 25 21 24 27 25 26 = 250 2. Sample Standard Deviation (SD)The SD is a measure of the variability of individual values in that sample from the sample mean.
2 It is calculated using the following equation:s = !!! !!!!To calculate the sample SD: 1. Subtract the mean from each Square the Sum the squared deviations for each Divide the summed deviations by (n 1).5. Calculate the square root. = mean x = individual sample values n = number of values in the sample s = standard deviation x ( )2 23 (23 25)! = 4 27 (27 25)! = 4 29 (29 25)! = 16 23 (23 25)! = 4 25 (25 25)! = 0 21 (21 25)! = 16 24 (24 25)! = 1 27 (27 25)! = 4 25 (25 25)! = 0 26 (26 25)! = 1 = 250 ( )2 = 50 s = ! (!!! )!!!!=!!"! = 3. Standard Error of the Mean (SEM or !)If you were to take many samples from a population, each sample mean would be slightly different.
3 All the sample means would be normally distributed around the population mean. The SEM or ! is the standard deviation of the distribution of these sample means. You can estimate the ! from a single sample mean using the equation below. As you can see from the equation, a larger sample size leads to a lower ! and a smaller sample size leads to a larger !. ! = !! ! = !.!"#!" = 4. 95% Confidence Interval (95% CI)The sample mean is an estimate of the population mean. How good an estimate? Based on your sample, you can estimate the range of values (or interval) likely to contain the actual population mean. This range is called the confidence interval.
4 You can calculate the confidence interval at different confidence levels. The 95% confidence interval tells you that if you collected many samples from the same population, the population mean would be within the 95% confidence interval for each sample 95% of the time. In this lab we will calculate 95% CI as 2 !. Note that this is just an approximation of the actual formula. 95% CI = 2 ! = 2 = = mean n = number of values in the sample s = standard deviation