Transcription of How to Conduct Path Analysis and Structural Equation Model ...
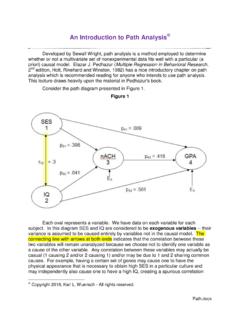
1 How to Conduct path Analysis and Structural Equation Model for Health Research Prof BhismaMurtiInternational Conference on Public HealthBest Western Premier Hotel, Solo, Indonesia, September 14-15, 2016 Masters Program in Public Health, Graduate Program. SebelasMaretUniversityWhat is path Analysis / SEM? path Analysis is the statistical technique based upon a linear Equation system used to examine causal relationships between two or more variables. It is just a series of regressions applied sequentially to data. In a regression Model , each Independent Variable (IV) has direct on the Dependent Variable (DV) In a path Analysis Model , in addition to direct effect there is also indirect effect of an Independent Variable (IV), via an mediating variable, on the Dependent Variable (DV)2 History of path Analysis path Analysis was first developed by Sewall Wright in the 1930s for use in phylogenetic studies. Gained popularity in 1960, when Blalock, Duncan, and others introduced them to social science ( status attainment processes).
2 The development of general linear models by Joreskogand others in 1970s ( LISREL models, linear Structural relations)3 path Analysis is AKA (Also Known As) SEM Structural Equation Modeling CSA Covariance Structure Analysis Causal Models Simultaneous Equations path Analysis Confirmatory Factor AnalysisNote: path Analysis and confirmatory factor Analysis (CFA) are components of SEM SEM is an extension of path Analysis4 SEM vs. Other Approaches Similar to standard approaches based on linear Model Based on statistical theory Conclusions valid only if assumptions are met Not a magic test of causality Statistical inference compromised if post hoc tests performed Different from standard approaches Requires formal specification of Model Allows latent variables Statistical tests and assessment of fit more ambiguous Can seem like less of a science; more of an art5 path Analysis / comprehensive statistical approach to testing hypotheses about relations among observed and latent variables (Hoyle, 1995) methodology for representing, estimating, and testing a theoretical network of (mostly) linear relations between variables (Rigdon, 1998).
3 Hypothesized patterns of directional and non-directional relationships among a set of observed (measured) and unobserved (latent) variables (MacCallum& Austin, 2000). is like SEM but has no latent variables6 Difference Between path Analysis and SEM path Analysis is a special case of SEM path Analysis contains only observed variables (no latent variable as SEM) path Analysis assumes that all variables are measured without error SEM uses latent variables to account for measurement error path Analysis has a more restrictive set of assumptions than SEM ( no correlation between the error terms)7 Difference Between path Analysis and SEM path Analysis is a subset of Structural Equation Modeling (SEM), a multivariate procedure path Analysis as defined by Ullman (1996) allows examination of a set of relationships between one or more independent variables, either continuous or discrete, and one or more dependent variables, either continuous or discrete.
4 SEM deals with measured and latent variables. SEM is a combination of multiple regression and factor Analysis . path Analysis deals only with measured Variable Ameasured variableis a variable that can be observed directly and is measurable. Measured variables are also known as observed variables, indicators or manifest variables. 9 Latent Variable Alatent variableis a variable that cannot be observed directly and must be inferred from measured variables. Latent variables are implied by the covariances among two or more measured variables. They are also known as factors ( , factor Analysis ), constructs or unobserved variables. 10 Components of SEM Structural Equation modeling (SEM), as a concept, is a combination of statistical factor Analysis 11 Example of SEM with Some Indicators in Each Latent VariablesSource: Hoyle 1995 Latent variablesIndicators (measured variables)12 path Analysis (No Latent Variables)Measured variables1314 The Goals of path / understand the patterns of correlation/ covariance among a set of explain as much of their variance as possible with the Model specified(Kline, 1998)15 SEM Process SEM process centers around two steps: Validating the measurement Model : accomplished primarily through confirmatory factor Analysis (CFA) Fitting the Structural Model : accomplished primarily through path Analysis with latent Purposes of CFA and path factor Analysis (CFA) Tests models of relationships between latent variables (LVs or common factors) and MVs which are indicators of common factors.
5 A test of the meaningfulness of latent variables and their indicators, but the researcher may wish to apply traditional tests (ex., Cronbach'salpha) Analysis ( , regression) Tests models and relationships among MVs. 17 Confirmatory Factor Analysis Confirmatory factor Analysis (CFA) may be used to confirm that the indicators sort themselves into factors corresponding to how the researcher has linked the indicators to the latent variables. Confirmatory factor Analysis plays an important role in Structural Equation modeling. CFA models in SEM are used to assess the role of measurement error in the Model , to validate a multifactorial Model , and to determine group effects on the factors18 Some Definitions Model : Statement about relationships between variables Specification: Act of formally stating a Model Examples:19 More Definitions Parameters: Parameters are constants Indicate the nature and size of the relationship between two variables in the population Can never know the true value of a parameter, but statistics help us make our best guess Parameters in SEM Can be specified as fixed (to be set equal to some constant like zero) free (to be estimated from the data) Parameters in other techniques Pearson correlation: one parameter is estimated (r) Regression.
6 Regression coefficients are estimated20 Indicators Indicators are observed variables, sometimes called manifest variables or reference variables For example, items in a survey instrument. Four or more is recommended, three is acceptable and common practice, Two is problematic, and with one measurement, error cannot be modeled. Models using only two indicators per latent variable are more likely to be under-identified and/or fail to converge Error estimates may be unreliable. 21 Caution About Indicators Indicator variables cannot be combined arbitrarily to form latent variables. For instance, combining gender, race, or other demographic variables to form a latent variable called "background factors" would be improper Because it would not represent any single underlying continuum of meaning. 22 Latent Variable Latent variables are the unobserved variables or constructs or factors which are measured by their respective indicators.
7 Latent variables include both independent, mediating, and dependent Elements Single-headed arrow This is prediction Regression Coefficient or factor loading Double headed arrow This is correlation Missing Paths Hypothesized absence of relationship Can also set path to zero24 Exogenous vsEndogenous Variables, Latent vsMeasured Variables25 Disturbances Every endogenous variable has a disturbance (aka. noise) These represent all omitted causes, plus any random or measurement error, , all variance that predictors didn t predict Also called residuals or error terms error term implies that there are no omitted causes (only error variance) Disturbances can be conceptualized as unmeasured (latent) exogenous variables They allow us to compute a percent variance explained for each endogenous variable26 Types of Associations Association: Non-directional relationship The type evaluated by Pearson correlation Direct: A directional relationship between variables The type of association evaluated in multiple regression or ANOVA The building block of SEM models Indirect: Two (or more) directional relationships V1 affects V2 which in turns affects V3 Relationship between V1 and V3 is mediated by V2 Total.
8 Sum of all direct and indirect effects27 Multiple Regression and SEM Can run regression analyses using SEM software Mathematics/computer algorithm used by SEM is different, but Parameter estimates will be identical or very close Note that fit will be perfect (number of observations and number of parameters are equal) Running in SEM buys nothing but, nice Analysis to start with SEM allows multiple DVs SEM allows two-group (or multi-group) comparisons28 Multiple Regression Diagram29 Multiple Regression Diagram with SEM30 Some examples of path Type Both IV s and DV s can be continuous, discrete, or even dichotomous. If DV is continuous, can use Model similar to regression Analysis can employ SPSS AMOS If DV is dichotomous, can use Model similar to regression Analysis can employ StataGSEM (generalized Structural Equation Model ) Independent variables are usually considered either predictor or causal variables because they predict or cause the dependent variables (the response or outcome variables).
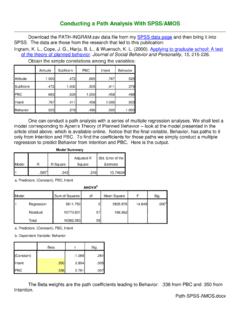
9 32 The relationships between the theoretical constructs are represented by regression or path coefficients between the factors. Theory Of Planned Behavior Depicted In path Diagram33 Diagram Elements Single-headed arrow This is prediction Regression Coefficient or factor loading Double headed arrow This is correlation Missing Paths Hypothesized absence of relationship Can also set path to zero34 Assumed Causal Relation in path and SEM Just as in path Analysis , the diagram for the SEM shows the assumed causal relations. If the parameters of the Model are identified, a covariance matrix or a correlation matrix can be used to estimate the parameters of the Model One parameter corresponds to each arrow in the Sample Size (degree of freedom) subjects for small to medium sized least, 10-20 subjects per estimated less than 5 subjects per estimated parameter For example:5 estimated parameter= 5 x 20 subjects= 100 subjects36 SEM Limitations Biggest limitation is sample size: It needs to be large to get stable estimates of the covariances/correlations Requirement for large sample size n< 100: small; 100-200: medium.
10 A minimum of 10 subjects per estimated parameter Also affected by effect size and required power375 Steps in path re-specification (if necessary)38 path Model is Specified Based on Theory of Planned Behavior (IcekAjzen)39 Model SpecificationModel Identification Model will be unidentified if #Parameters > #Observations Note: In PA and SEM, the number of observations is not based on the sample size, but rather, on the number of variables in the Model (k). The specific formula is: Number of observations = [k (k + 1)]/240 Theory of Planned Behavior depicted in path diagramDirect effectIndirect effect41 Theory of Planned Behavior depicted in path diagramDirect effectIndirect effectTwo regression Behavior intention + Perceived Behavior intention= Attitude toward act or behavior + subjective norm + perceived behavior controlFor each endogenous (DV) variable, a regression Analysis is regression Behavior intention + Perceived Behavior intention= Attitude toward act or behavior + subjective norm + perceived behavior controlTheory of Planned Behavior depicted in path diagramDirect effectIndirect effectP b, pcbP b, biP bi, atbP bi, snP bi, pcb43 path Analysis path coefficients are standardized ( Beta ) or unstandardized ( B or ( ) regression coefficients.)