Transcription of How to Estimate the Long-Term Growth Rate in the ...
1 Www .willamette .com INSIGHTS SPRING 2013 9 How to Estimate the Long-Term Growth Rate in the discounted Cash Flow MethodAaron Rotkowski and Evan CloughForensic Analysis Insights Business ValuationIn forensic analysis engagements where the value of a company or security is disputed, one topic that the litigants often disagree about is the selection of the expected Long-Term Growth rate used in the discounted cash flow method. The expected Long-Term Growth rate may be contested because (1) small changes in the selected Growth rate can lead to large changes in the concluded business or security value and (2) the Long-Term Growth rate is a judgment-based valuation input. Because of these two factors, judges, mediators, and arbitrators may view the analyst s selected Long-Term Growth rate skeptically. This discussion provides qualitative and quantitative factors that analysts may consider to support the selection of an expected Long-Term Growth analysts are often retained to Estimate the fair value or fair market value of a company or security for a variety of forensic analysis purposes, including taxation, bankruptcy, lender liability, shareholder disputes, GAAP compliance, intellectu-al property infringement, contract dispute, condem-nation/eminent domain, and other these assignments, the valuation analyst may consider the income approach and, specifically, the discounted cash flow (DCF) method to value the subject company or discussion focuses on the procedure to esti-mate one of the important valuation variables in the DCF method.
2 The subject company s expected Long-Term cash flow Growth rate in Delaware Chancery Court (the Chancery Court ) is widely recognized as the nation s pre-eminent forum for the determination of disputes involving the internal affairs of the thousands upon thousands of Delaware corporations and other busi-ness entities through which a vast amount of the world s commercial affairs [are] conducted. 1 The Chancery Court has noted that the DCF method is a generally accepted method to value a business or security. In particular, the Chancery Court notes that the DCF [method] has featured prominently in this Chancery Court because it is the approach that merits the greatest confidence within the financial community 2 and if a [DCF method] reveals a valuation similar to a comparable companies or comparable transactions analysis, [the Chancery Court has] more confidence that both analyses are accurately valuing a company.
3 3 The DCF method involves a projection of the company s results of operation for a discrete, multi-year period. The discrete cash flow projection is then converted to a single present value. The DCF method typically involves a terminal value analysis at the end of the discrete projection terminal value is the present value of the stabilized benefit stream capitalized into the future, 4 where the future represents all periods after the discrete projection the DCF method, it is not uncommon for the terminal value to account for 75 percent or more of the total company or security value. This conclusion is especially true when there are fewer discrete pro-jection periods between the valuation date and ter-minal period that is, the terminal value accounts for more of the projected economic benefit of the company and thus a higher proportion of the total INSIGHTS SPRING 2013 www .willamette.
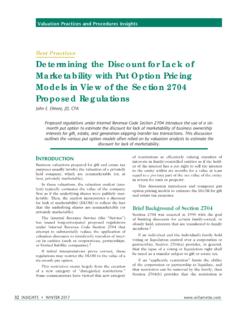
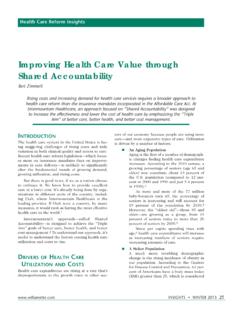
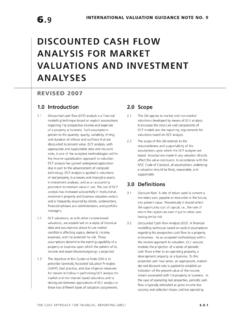
4 ComThe Gordon Growth model (GGM) is a method that is often used to calculate the terminal value in a DCF method analysis. This terminal value estima-tion model can be sensitive to the expected Long-Term Growth (LTG) Because a small change to the LTG rate can have a large impact on the concluded value, the LTG rate is often one of the disputed variables in valuations prepared for foren-sic analysis 1 demonstrates the sensitivity of the concluded terminal value to the selected LTG rate (as calculated by the GGM), assuming the following illustrative valuation variables:1. A 15 percent weighted average cost of capi-tal (WACC)2. A terminal period cash flow of $10 As shown in Figure 1, an increase in the LTG rate from 3 percent to 4 percent causes an increase in the terminal value of 10 percent. An increase in the LTG rate from 5 to 6 percent causes an increase in the terminal value of 11 the potential controversy regarding the selection of the LTG rate in the DCF method, this discussion considers the following topics:1.
5 How the LTG rate relates to (a) the subject company or security and (b) the concluded terminal value2. The factors that affect the LTG rate selec-tionthe gordon Growth modelAs previously discussed, one common method used to calculate the DCF method terminal value is the Gordon Growth model. The GGM formula8 is pre-sented as follows:PV = (NCF0 ( 1 + g )) ( k g )where:PV = Present valueNCF0 = Net cash flow in the final discrete projection period9g = Selected Long-Term Growth ratek = Selected cost of capitalThe first procedure to calculate the terminal value using the GGM is to Estimate the normalized Long-Term income stream ( , terminal period net cash flow, or NCF) at the end of the discrete projec-tion period. This income stream should take into account the stable, normalized economic returns of the next procedure in the GGM is to capitalize the terminal NCF at a risk and Growth adjusted capi-talization rate ( , the direct capitalization rate).
6 The GGM estimates the terminal value based on the premise that the NCF will increase (or decrease) in perpetuity at a constant annual rate. The appro-priate GGM direct capitalization rate equals the company WACC (which incorpo- rates the risk of the company cash flow) minus the selected LTG rate (which incorporates the expected Growth of the company cash flow).Once the direct capitalization rate is calculated, the projected terminal period s NCF is divided by that direct capitalization rate to derive the terminal the terminal value is calculated as of the end of the discrete projection period, the last procedure in the application of the GGM is to compute the present value of the terminal Long-Term Growth rate is not used in this procedure. Instead, the same present value factor applied to the final discrete period s pro-jected NCF is also applied to the terminal value in order to convert it to the present value as of the valuation date.
7 $83$91$100$111$0$20$40$60$80$100$ RateTerminal ValueFigure 1 Sensitivity of GGM to Selected LTG Ratewww .willamette .com INSIGHTS SPRING 2013 11ltg rAte deFinition The terminal value incorporates the value of all the company s cash flow following the final discrete projection period, into perpetuity. That period is referred to as the terminal period for purposes of this discussion. As such, when an analyst selects a Long-Term Growth rate, the analyst is effectively con-cluding that the company s cash flow will increase (or decrease) at the constant LTG rate first glance, it may seem unrealistic to assume that a company will experience positive (or negative) Growth forever especially if the analyst selects a Growth rate that is greater than the pro-jected rate of inflation (and, in doing so, implicitly projects that the company will grow to infinite size over infinite time). However, the majority of the terminal value is generated by the cash flow that occurs within the first few periods beyond the dis-crete projection , when the analyst selects a LTG rate for the GGM, he or she is essentially estimating the annual percentage changes in a company s cash flow over the first 10 to 20 years beyond the terminal GGM is a formula to calculate the net pres-ent value ( , the terminal value ) for all future periods into perpetuity.
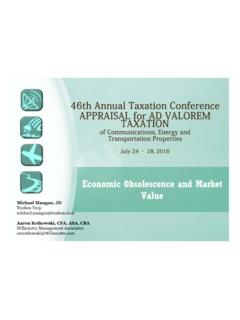
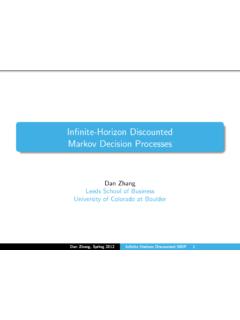
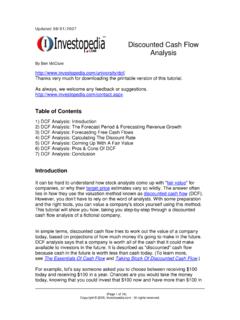
8 In essence, it is a collapsed version of the formula that represents a summation of the present value of each individual period in the terminal period discounted to the beginning of the terminal period at the direct capitalization the direct capitalization rate equals the selected WACC minus the selected LTG, the propor-tion of the terminal value that is generated in each successive period depends on the spread between these two other words, given the same WACC, a lower LTG rate causes a higher proportion of terminal value to be generated in the near term, while a higher LTG rate causes the opposite is because a higher LTG rate causes cash flow to increase more rapidly into the future, which consequently causes future periods to have rela-tively higher present 2 through 4 graphically present the annual and cumulative percentage of the terminal value in the first 20 years of the terminal period, based on the following valuation variables:1.
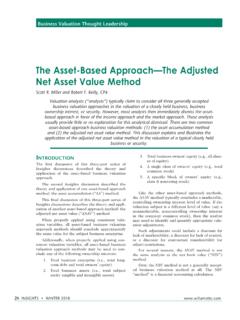
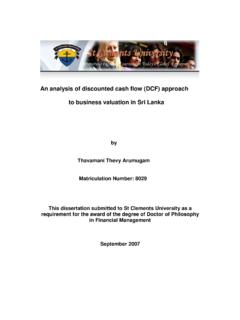
9 A WACC of 15 percent2. Normalized cash flow in the first terminal period of $1003. LTG rates between 0 percent and 5 per-cent12 The vertical bars in Figures 2 through 4 pres-ent the present value of annual cash flow during the terminal period and the curved horizontal line $0$10$20$30$40$50$60$70$80$90$1001 2 3 4 5 6 7 8 91011121314151617181920 Cumulative % of Terminal ValuePresent Value of Cash Flow (000)PeriodPresent Value of Cash FlowCumulative % of Terminal ValueFigure 2 WACC 15 Percent, LTG 0 Percent12 INSIGHTS SPRING 2013 www .willamette . $0$10$20$30$40$50$60$70$80$90$1001 2 3 4 5 6 7 8 91011121314151617181920 Cumulative % of Terminal ValuePresent Value of Cash Flow (000)PeriodPresent Value of Cash FlowCumulative % of Terminal ValueFigure 3 WACC 15 Percent, LTG $0$10$20$30$40$50$60$70$80$90$1001 2 3 4 5 6 7 8 91011121314151617181920 Cumulative % of Terminal ValuePresent Value of Cash Flow (000)PeriodPresent Value of Cash FlowCumulative % of Terminal ValueFigure 4 WACC 15 Percent, LTG 5 Percentwww.
10 Willamette .com INSIGHTS SPRING 2013 13presents the cumulative percentage of the total ter-minal value of the presented cash flow for periods 1 through 2 demonstrates that with a selected LTG rate of 0 percent, periods 1 through 20 account for percent of the terminal value. Figure 3 demon-strates that with a selected LTG rate of percent, periods 1 through 20 account for percent of the terminal 4 demonstrates that with a selected LTG of percent, periods 1 through 20 account for percent of the terminal positive correlation between the LTG rate and the proportion of value generated in later peri-ods is paradoxical. Later projection periods and higher selected LTG rates generally drive a greater degree of uncertainty, which means that selecting a higher LTG rate causes uncertainty in later periods to be amplified by their relatively increased propor-tion of the terminal , this concern is usually mitigated by the fact that the amplitude of this effect is generally somewhat small that is, sooner periods still gener-ate a much larger proportion of terminal value than later periods, even when the selected LTG rate may be relatively of the large proportion of the terminal value that is accounted for in the first 20 or so peri-ods following the discrete projection period, it is possible to make a reasonable directional prediction about the subject company cash directional cash flow prediction is captured by the LTG rate.