Transcription of How to Use SPSS for Contingency Table, Relative Risk, Odds ...
1 Contingency Table and Chi-square Test 1 How to Use SPSS for Contingency Table, Relative Risk, Odds Ratio and Chi-Square Test Example: Suppose we conducted a prospective cohort study to investigate the effect of aspirin on heart disease. A group of patients who are at risk for a heart attack are randomly assigned to either a placebo or aspirin. At the end of one year, the number of patients suffering a heart attack is recorded. Heart Disease Group Yes + No Total Placebo 20 80 35 Aspirin 15 135 215 Total 100 150 250 Odds ratio (of having heart disease for placebo Aspirin)= (20x135)/(80x15)= Relative risk (of having heart disease for placebo Aspirin)= (20/100)/(15/150)=.
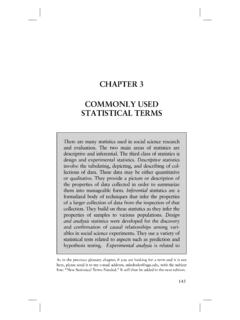
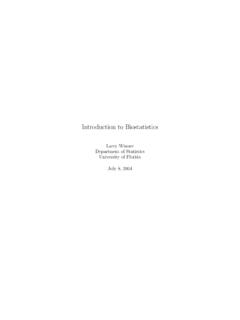
2 2/.1 = 2 (The risk of a heart attack for people on placebo is twice that of people on aspirin.) Step 1: (Go to Step 2 if data is raw data and not organized frequencies as in figure (a).) First, create the data in SPSS Data Editor as in (a), and then weight the cases entered in the Data Editor by click Data and select Weight Cases as in (b). In the Weight Cases dialog box select freq variable for weighting the cases. Weight Cases will allow users to be able to make a Contingency table with the joint frequency distribution entered in (a) and each associate with a joint class. For example, 20 is the frequency for Yes and Placebo . The disease variable has internal values 0 and 1 (0 is labeled as Yes and 1 is labeled as No). The factor variable has internal values 0 and 1 (0 is labeled as Placebo and 1 is labeled as Aspirin). (a) (b) (c) Contingency Table and Chi-square Test 2 Step 2: Following the procedure below (Analyze/Descriptive Statistics/Crosstabs) to make the Contingency table.
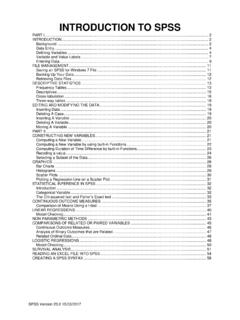
3 In SPSS, the row variable is risk factor and column variable is outcome variable. Risk Ratio for FACOTOR(Placebo / Aspirin)For cohort DISEASE = YesFor cohort DISEASE = NoN of Valid CasesValueLowerUpper95% Confidence Interval Odds ratioRelative riskClick Statistics and check the Risk box in the Crosstabs: Statistics dialog window to obtain risk measurement for obtaining the following Risk Estimate table. Contingency Table and Chi-square Test 3 FACTOR * DISEASE CrosstabulationCount20801001513515035215 250 PlaceboAspirinFACTORT otalYesNoDISEASET otal Chi-Square Chi-SquareContinuity CorrectionaLikelihood RatioFisher's exact TestLinear-by-LinearAssociationN of Valid CasesValuedfAsymp. Sig.(2-sided) exact Sig.(2-sided) exact Sig.(1-sided)Computed only for a 2x2 tablea. 0 cells (.0%) have expected count less than 5. The minimum expected count p-values less than implies significant relation