Transcription of Hurricane Isabel National Hurricane Center
1 -1-Tropical Cyclone ReportHurricane Isabel6-19 September 2003 Jack Beven and Hugh CobbNational Hurricane Centerrevised 1 July 2004 Updated 9 September 2014 for damageHurricane Isabel was a long-lived Cape Verde Hurricane that reached Category 5 status onthe Saffir-Simpson Hurricane Scale. It made landfall near Drum Inlet on the Outer Banks of NorthCarolina as a Category 2 Hurricane . Isabel is considered to be one of the most significant tropicalcyclones to affect portions of northeastern North Carolina and east-central Virginia since HurricaneHazel in 1954 and the Chesapeake-Potomac Hurricane of 1933.
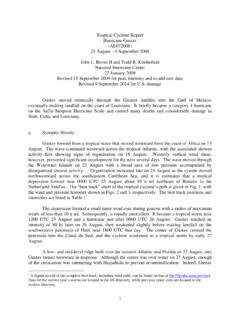
2 HistoryIsabel formed from a tropical wave that moved westward from the coast of Africa on 1 September. Over the next several days, the wave moved slowly westward and gradually becamebetter organized. By 0000 UTC 5 September, there was sufficient organized convection for satellite-based Dvorak intensity estimates to begin. Development continued, and it is estimated that a tropicaldepression formed at 0000 UTC 6 September, with the depression becoming Tropical Storm Isabelsix hours later. The best track chart of Isabel is given in Fig.
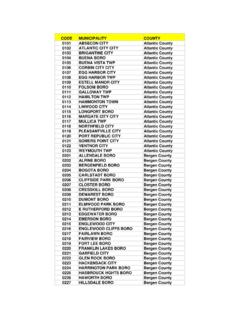
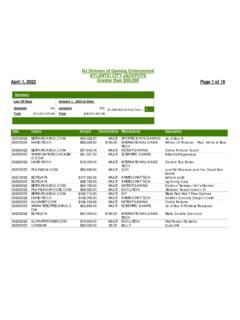
3 1, with the wind and pressurehistories shown in Figs. 2 and 3, respectively. The best track positions and intensities are listed inTable turned west-northwestward on 7 September and intensified into a continued for the next two days while Isabel moved between west-northwest andnorthwest. Isabel turned westward on 10 September and maintained this motion until 13 Septemberon the south side of the Azores-Bermuda High. Isabel strengthened to a Category 5 Hurricane on 11 September with maximum sustained winds estimated at 145 kt at 1800 UTC that day.
4 After thispeak, the maximum winds remained in the 130-140 kt range until 15 September. During this time, Isabel displayed a persistent 35-45 n mi diameter eye. Isabel approached a weakness in the western portion of the Azores-Bermuda High, whichallowed the Hurricane to turn west-northwestward on 13 September, northwestward on 15,September, and north-northwestward on 16 September. The latter motion would continue for therest of Isabel s life as a tropical vertical wind shear on 15 September caused Isabel to gradually weaken. Thesystem weakened below major Hurricane status (96 kt or Category 3 on the Saffir-Simpson HurricaneScale) on 16 September.
5 It maintained Category 2 status with 85-90 kt maximum winds for the nexttwo days while the overall size of the Hurricane increased. Isabel made landfall near Drum Inlet,-2-North Carolina near 1700 UTC 18 September as a Category 2 Hurricane , then weakened as it movedacross eastern North Carolina. It weakened to a tropical storm over southern Virginia, then losttropical characteristics as it moved across western Pennsylvania on 19 September. ExtratropicalIsabel moved northward into Canada and was absorbed into a larger baroclinic system movingeastward across south central Canada early the next StatisticsObservations in Isabel (Figs.)
6 2 and 3) include satellite-based Dvorak technique intensityestimates from the Tropical Analysis and Forecast Branch (TAFB), the Satellite Analysis Branch(SAB) and the U. S. Air Force Weather Agency (AFWA). Also included are flight-level anddropwindsonde observations from flights by the 53 Weather Reconnaissance Squadron of the Air Force Reserve Command, the NOAA Aircraft Operations Center , and a Canadian researchaircraft. Observations from ships (Table 2), land stations, and data buoys (Table 3) are includedwhere appropriate. Microwave satellite imagery from the National Aeronautics and SpaceAdministration (NASA) Tropical Rainfall Measuring Mission (TRMM), the NASA Quikscat, andthe Defense Meteorological Satellite Program (DMSP) satellites were also useful in tracking Isabel .
7 The Air Force Reserve Hurricane Hunters made 39 Center fixes during Isabel . The NOAAH urricane Hunters made two formal Center fixes and flew seven research missions into the highest winds measured by the aircraft were 158 kt (Air Force at 700 mb) and 157 kt (NOAAat 8400 ft) between 1700-1730 UTC 13 September. A 156-kt flight-level wind (700 mb) was alsoobserved at 1719 UTC 12 September. Stronger winds were observed on eyewall dropsondes, witha maximum of 203 kt reported at 806 mb (4500 ft) at 1753 UTC 13 September. This is the strongestwind ever observed in an atlantic Hurricane , although it likely does not represent a 1-min of the aircraft and satellite data makes the peak intensity of Isabel somewhatspeculative.
8 Aircraft data on 12 September indicate that Isabel had winds near 140 kt. However,the maximum intensity based on satellite imagery was reached on 11 September before the firstreconnaissance mission, and the satellite signature was weaker at the time of the first mission. Themaximum intensity estimate of 145 kt on 11 September is based on the aircraft data of 12 Septemberand the stronger satellite signature on the previous day. The minimum central pressure of 915 mbon 11 September has a similar basis. Isabel s intensity is also somewhat uncertain during 16-18 September.
9 During this time,a large outer eyewall formed, which disrupted the inner core wind structure. Dropsonde dataindicated that the usual 90% reduction for 700 mb winds to the surface in the eyewall was not valid,with the actual reductions being closer to 70-75%. Both Air Force and NOAA aircraft measured118-kt flight-level winds in the northeast eyewall just as Isabel was making landfall, which using the90% reduction would support 105 kt sustained surface winds. However, using a 75% reductiongives a sustained surface wind of near 90 kt, which is in better agreement with maximum surfacewinds estimated by a dropsonde (83 kt) and the Stepped Frequency Microwave Radiometer on theNOAA aircraft (90 kt) near the same time.
10 Based on this, the best estimate of the landfall intensityis 90 brought Hurricane conditions to portions of eastern North Carolina and southeasternVirginia. The highest observed wind on land (Table 3) was sustained at 70 kt with a gust to 88 ktat an instrumented tower near Cape Hatteras, North Carolina at 1648 UTC 18 September. Anothertower in Elizabeth City, North Carolina reported 64-kt sustained winds with a gust to 84 kt at 1851 UTC that day. The National Ocean Service (NOS) station at Cape Hatteras reported 68-kt sustainedwinds with a gust to 83 kt at 1518 UTC that day just before the station was destroyed.