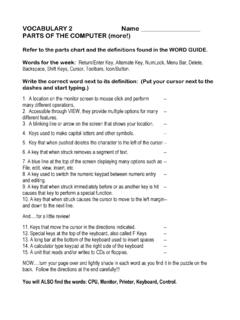
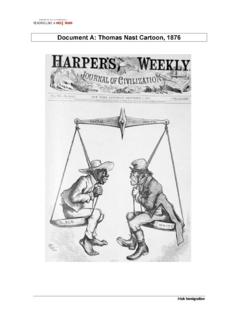
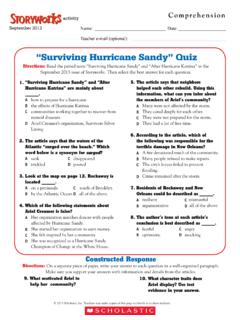
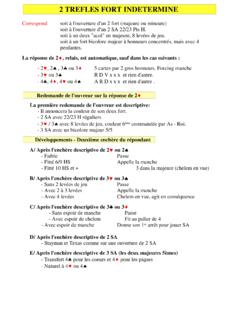
Transcription of Hurricane Katrina Tracking Lab
1 Name: _____ Date: _____ Class Period: _____. Hurricane Katrina Tracking Lab Introduction: Katrina as a category 5 Hurricane The 2005 Hurricane season was the most active season on over the Gulf of Mexico. record resulting in 28 named storms. Hurricane Katrina was the eleventh named storm and would end up being the sixth most powerful Atlantic Hurricane ever recorded and the third most destructive Hurricane to make landfall in the US. Katrina formed in the western Atlantic Ocean as a tropical depression over the Bahamas on August 23, 2005. Warm water and moisture-laden air provided enough energy for the storm system to strengthen and eventually become a tropical storm, then a Hurricane . Once Hurricane Katrina moved into the Gulf of Mexico it strengthened rapidly becoming a category 5 Hurricane . However, before it reached landfall it had weakened to a category three Hurricane .
2 Despite this, it was still strong enough to cause severe damage to the Gulf coast region in eastern Louisiana and the Louisiana/Alabama state line. Most notably it breached the levees in New Orleans leaving 80% of the city under water. Over 1800 people were killed as a result of this storm as well as causing an estimated $ billion dollars in damages. In this lab, you will use data from Hurricane Katrina to study some weather conditions common to all hurricanes. You will also plot on a map showing the path of Hurricane Katrina . Materials: Sharpened Pencil, Map of the Western Atlantic Procedure 1. Plot the latitude and longitude for each date on the map of the Western Atlantic provided to show the path of the Hurricane . 2. Number each point (position) in order along the path of the Hurricane making it easier to locate the where the Hurricane was for each given date.
3 3. Connect each point with a line and draw arrows on the line indicating the direction the Hurricane was moving. Ex. 4. Answer the analysis questions. Mr. Bealer's Earth Science Lab Manual for the 2006-2007 school year. Solvay High School, Solvay, NY 13209. Permission given to all certified teachers to use or modify for their students in non-for-profit activities. 1. Name: _____ Date: _____ Class Period: _____. Selected Data For Hurricane Katrina Position Latitude Longitude Date Time Wind Speed Pressure Status (oN) (oW) (Y = 2005) (knots) (millibars). 1 08/23 9 pm 30 1007 Tropical Depression 2 08/24 3 pm 35 1006 Tropical Storm 3 08/25 9 am 45 1000 Tropical Storm 4 08/25 9 pm 65 985 Hurricane -1. 5 08/26 9 am 65 987 Hurricane -1. 6 08/27 3 am 90 965 Hurricane -2. 7 08/27 9 am 100 945 Hurricane -3. 8 08/28 3 am 100 939 Hurricane -3. 9 08/28 6 am 125 935 Hurricane -4. 10 08/28 9 pm 145 902 Hurricane -5.
4 11 08/29 9 am 130 915 Hurricane -4. 12 08/29 3 pm 110 927 Hurricane -3. 13 08/29 9 pm 65 960 Hurricane -1. 14 08/30 3 am 50 973 Tropical Storm 15 08/30 3 pm 30 985 Tropical Depression 16 08/30 9 pm 25 991 Tropical Depression 17 08/31 3 am 25 994 Tropical Depression 18 08/31 9 pm 15 996 Tropical Depression Mr. Bealer's Earth Science Lab Manual for the 2006-2007 school year. Solvay High School, Solvay, NY 13209. Permission given to all certified teachers to use or modify for their students in non-for-profit activities. 2. Name: _____ Date: _____ Class Period: _____. Analysis Questions 1. What is the difference between the highest and lowest air pressure readings on the data table? Show your work. 2. Identify the wind speed, air pressure, and status of Katrina on August 28th at 9:00 pm. Include the correct units. a. wind speed = _____. b. air pressure = _____. c. status = _____.
5 3. In general, how did Katrina 's wind speed change before August 28th at 9:00 pm? .. and after August 28th at 9:00 pm? a. before August 28th at 9:00 pm: _____. b. after August 28th at 9:00 pm: _____. 4. In general, how did Katrina 's air pressure change before August 28th at 9:00 pm? .. and after August 28th at 9:00 pm? a. before August 28th at 9:00 pm: _____. b. after August 28th at 9:00 pm: _____. Mr. Bealer's Earth Science Lab Manual for the 2006-2007 school year. Solvay High School, Solvay, NY 13209. Permission given to all certified teachers to use or modify for their students in non-for-profit activities. 3. Name: _____ Date: _____ Class Period: _____. 5. Based upon your answers from questions 3 and 4, what is the general relationship between changes in air pressure and the wind speed in a Hurricane ? _____. 6. From 9:00 am on August 26th (location 5) to 9:00 pm on August 28th (location 10), Hurricane Katrina strengthened significantly.
6 A. According to the map, where was Katrina located at these times? _____. b. What did this area provide to the storm to help strengthen it so much? _____. 7. New Orleans, LA was one of the most notable cities destroyed by Hurricane Katrina , yet cities located farther inland received much less damage. Why? _____. _____. References Map of Western Atlantic National Weather Service. Retrieved September 16, 2006, from National Hurricane Center Web site: Hurricane Katrina Data 2005 Hurricane /Tropical Data for Atlantic. Retrieved September 16, 2006, from Unisys Weather Web site: (2006, September 16). Hurricane Katrina . Retrieved September 16, 2006, from Wikipedia Web site: Mr. Bealer's Earth Science Lab Manual for the 2006-2007 school year. Solvay High School, Solvay, NY 13209. Permission given to all certified teachers to use or modify for their students in non-for-profit activities.
7 4. Name: _____ Date: _____ Class Period: _____. Mr. Bealer's Earth Science Lab Manual for the 2006-2007 school year. Solvay High School, Solvay, NY 13209. Permission given to all certified teachers to use or modify for their students in non-for-profit activities. 5.