Transcription of Husky Energy Inc.
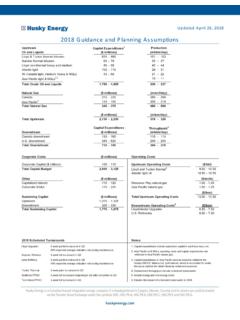
1 Husky Energy Inc. July 2018 Husky Energy Inc. July 2018 Value PropositionResilient and Well Positioned to Capture UpsideGrowingFunds Flow and Free CashImproving Cost Structure and Margin CaptureReturns-Focused GrowthRe-Investment and Dividend2 Production and throughput growth from a large inventory of low cost projects = returns-focused growth Low and improving earnings and cash break-evens Strong growth in funds from operations and free cash flow Increasing cash returns to shareholders Integration and fixed-price Asia Pacific sales provide resilience to volatile market conditions while preserving upsideHusky Energy Inc. July '18F '19F '20F '21F '22F3 Updated Five-Year Plan ( 2018 -2022)Plan Remains On Track, Using Flat $60 US WTI $BFunds From Operations CAGR 18F- 22F6%Key Metrics 18F 22F 18F-22 FCAGR1 Funds from operations (FFO)2,3$4B$5B6%Free cash flow (FCF)4$1B$ production (mboe/day)310-320410-4207%Downstream throughputs (mbbls/day)360-370360-370 Thermal bitumen production (mbbls/day)126-13020012%Heavy processing capacity (mbbls/day)190220 Upstream operating cost/bbl$ $11-12 Downstream operatingcosts/bbl(CAD)$7-8$7-8 Earnings break-even oil price (US WTI)5$42$37 Ranges and Targets2018F -2022 FAnnual base dividend$500 MMSustaining capital6 Avg.
2 $ spending7,8 Avg. $ avg. proved reserves replacement ratioTarget >130%Net debt to FFO9at $35 US WTI<2x1,2,3,4,5,6,7,8,9 See Slide Notes and AdvisoriesHusky Energy Inc. July 201801234 HuskyABCDE4 Resilience to Unpredictable Commodity PricesSetting Husky ApartNet Debt to Trailing FFO1 (Q2 18)Peer GrouptimesResilience through: Strong balance sheet Integrated model Growing high netback, fixed-price business in Asia High weighting of low sustaining capital assets and projects Low earnings break-evensSource: Factset, Company DocumentsPeer group: CNRL, Cenovus, Encana, Imperial and Suncor1 See Slide Notes and AdvisoriesHusky Energy Inc. July 20185xxResilience through: Strong balance sheet Integrated model Growing high netback, fixed-price business in Asia High weighting of low sustaining capital assets and projects Low earnings break-evensTight Integration Largely Eliminates DifferentialsSetting Husky ApartHusky Energy Inc.
3 July 2018 Growing High Netback Business in AsiaSetting Husky Apart6 Resilience through: Strong balance sheet Integrated model Growing high netback, fixed-price business in Asia High weighting of low sustaining capital assets and projects Low earnings break-evens010203040506070'14'18F'22 Fmboe/day8%92%19%81%18%82%Asia Pacific Production GrowthAsia Pacific Funds From Operations as Percentage of TotalAsia Pacific FFOR emaining Corporate FFOH usky Energy Inc. July 20187 Resilience through: Strong balance sheet Integrated model Growing high netback, fixed-price business in Asia High weighting of low sustaining capital assets and projects Low earnings break-evensGrowing Proportion of Low Sustaining Capital ProjectsSetting Husky ApartTotal Sustaining Capital0123 '14 '18F '22 FDownstreamUpstreamThermal Bitumen Production as a Percentage of Total16%84%49%51%41%59%$BThermal ProductionRemaining Corporate ProductionHusky Energy Inc.
4 July 20188 Resilience through: Strong balance sheet Integrated model Growing high netback, fixed-price business in Asia High weighting of low sustaining capital assets and projects Low earnings break-evensLow Break Evens, And Going LowerSetting Husky Apart 34 36 38 40 42 44'18F'19F'20F'21F'22F 22F Earnings Break Even(US WTI per barrel) $37 $US WTI/bblEarnings Break-Even Oil PriceHusky Energy Inc. July 20189 Resilience through: Strong balance sheet Integrated model Growing high netback, fixed-price business in Asia High weighting of low sustaining capital assets and projects Low earnings break-evensSetting Husky Apart0%10%20%30%40%50%60%70%80%90%100%'1 8F'19F'20F'21F'22FW. Canada Heavy Oil ShieldedThrough IntegrationW.
5 Canada Gas Not Exposed to AECO DiscountAsia Pacific Gas Receiving ~5x Current AECO Gas PriceOffshoreLiquids Receives World Oil PricingW. Canada Oil and Gas Exposed to Market Pricing Production Mix and Commodity Price ExposureHusky Energy Inc. July 2018 ESG Performance and Reporting Measuring Performance and Improving Disclosures10 Water use and availabilityAir emissions management, including carbonLand use and reclamationCommunity & Indigenous People s EngagementBusiness ethics and transparencyTalent management and culture of inclusionBusiness resilienceInnovation and advanced technologyEnergy useOccupational health and safetyEmergency preparedness and responseAsset integrity and reliabilityEconomicSafety & ReliabilityGovernanceSocialEnvironmentHu sky Energy Inc.
6 July 2018 Two BusinessesEach HasBuilt-in Sustainable Competitive AdvantagesIntegrated CorridorOffshore11 Asia PacificAtlanticResource PlaysThermalDownstreamHusky Energy Inc. July 201812 Five-Year Plan MilestonesProject Execution in the Integrated Corridor and Offshore12 Husky Energy Inc. July <2X net debt to capital base for margin and FFO discretionary free cash flow Return to shareholders Organic/inorganic growthSpending Priorities13$ Free Cash Flow After Dividends at $60 US WTI 18- 22 FHusky Energy Inc. July FrameworkSustainable Model Through the Cycles With Free Cash Flow Upside142018 Portfolio2022 Portfolio$BFFO Sources and Uses at Various Oil Prices (US WTI)1$35 WTI$60 WTI$70 WTI$80 WTI$35 WTI$60 WTI$70 WTI$80 WTIS ustaining CapitalSustaining CapitalPlanned Growth CapitalGrowth CapexDividendsDividendsFFOFFOUsesUses Maintain balance sheet strength Invest in portfolio to: Generate returns Lower cost structure Grow funds from operations and free cash flow Return cash to shareholders Optimize deployment of discretionary free cash flowFree Cash Flow to AllocateFree Cash Flow to AllocatePlan Execution1 See Slide Notes and AdvisoriesHusky Energy Inc.
7 July 2018 Net debt $ billion, including $ billion in cash $ billion in unused credit facilities Total debt to capitalization: (Q2 18) Debt target: <2x net debt to FFO at bottom of cycle Investment grade credit rating151 see Slide Notes and Advisories15 Net Debt to Trailing FFOB alance SheetLow Leverage, Ample '18'19'20'21'22'23'24'25'26'27'37 USD Bonds ($/$US)CAD Bonds ($)Preferred Shares ($) sBaa2 ; StableS StableDBRSA (low); Stable Credit RatingsDebt Maturity Schedule$Btimes$ $ CapacityMax Net Debt Target (2x FFO @ $35)Estimated Net DebtIllustrative 2x Net Debt to FFO Debt Capacity at US$35 WTIAll figures as at end Q2 182018 Portfolio2022 PortfolioPlan ExecutionPeer Group---Peer Group:Cenovus, CNRL, Encana, Imperial, Suncor$BHusky Energy Inc.
8 July 2018 10 11 12 13 14 15 '18F '19F '20F '21F'22F16 Capex Program Drives Improving Cost Structure Lowering Operating Costs and Break-Even Oil Price New investment hurdle rate of 10% IRR at $45 US WTI and/or $ per mcf AECO Investment options in both the Integrated Corridor and Offshore Approximately two-thirds of capital plan to be directed to short and mid-cycle projectsUpstream Op Costs 18F- 22F15%$/boe 34 36 38 40 42 44'18F'19F'20F'21F'22F 22F Earnings Break-EvenUS WTI per barrel $37 $US WTI/bblEarnings Break-Even Oil PriceUpstream Operating Costs17 Husky Energy Inc. July 201818 Integrated CorridorOptimizing the Entire Value ChainReserves base (YE 17) billion boe of proved & probable reserves Production of 233 mboe/day (Q2 18) 123 mbbls/day thermal bitumen 63 mbbls/day non-thermal oil and liquids 285 mmcf/day gasRefining and upgrading capacity1 Total processing capacity 400 mbbls/day Heavy processing capacity 190 mbbls/dayFinished products (Q2 18) 47 mbbls/day of sweet synthetic oil 25 mbbls/day of asphalt 104 mbbls/day of diesel / jet fuel 145 mbbls/day of gasoline1 See Slide Notes and AdvisoriesHusky Energy Inc.
9 July 2018050100150200250300350400'18F'19F'20F '21F'22F19 Integrated CorridorGrowing Higher Quality Production and Increasing Downstream FlexibilityIntegrated Corridor Upstream Production ProfileThermal DevelopmentWestern Canada ProductionCold & EORmboe/dayHeavy Oil & Bitumen Production (bbls/day)2018F2022 FLloyd Thermal77,000135,000 Tucker24,00030,000 Sunrise26,00038,000 Cold & EOR43,00040,000 Total170,000243,000 Thermal as % of total75%84%Western Canada Production (boe/day)2018F2022 FResource plays30,00070,000 Other W. Canada production34,00020,000 Total64,00090,000 Resource plays as % of total47%78%Downstream Throughputs Capacity (bbls/day)2018F2022 FHeavy oil processing capacity1190,000220,000 Light oil processing capacity1210,000180,000 Total refining and upgrading capacity1400,000400,000 Heavy oil capacity as % of total48%55%1 See Slide Notes and AdvisoriesHusky Energy Inc.
10 July 2018 $ $ $ $ $ $ $ $ $ $ $ $ '17Q2 '17Q3 '17Q4 '17Q1 '18Q2 '18 Incremental Operating Netback From IntegrationLloyd Upstream Operating NetbackLloyd AdvantageFull Value Chain Netbacks20 Low cost thermal production Low cost refining and upgrading Higher value, diverse basket of finished products1,2 Higher finished product yield (98%) Extensive local market demand$/bblLloyd Value Chain Operating Netback3 Lloyd Value Chain (Q2 18)Estimated Lloyd Value Chain Operating Netback($ per barrel, Q2 2018 )1,2,3 See Slide Notes and Advisories$ Energy Inc. July 20181,2 See Slide Notes and Advisories$ $ $ $ $ $ $ $ $ $ $ $ '17Q2 '17Q3 '17Q4 '17Q1 '18Q2 '18 Incremental Operating Netback From IntegrationSunrise Operating NetbackSunrise to Toledo One-Step Refining, No Upgrading Required21 Toledo high-TAN project added processing capacity for all Sunrise crude Dilbitdelivered directly to Toledo No upgrading cost, no volume lost High finished product yield1,2 Sunrise Value Chain Operating Netback$/bbl$ Value Chain (Q2 18)Estimated Sunrise Value Chain Operating Netback($ per barrel, Q2 2018 ) Husky Energy Inc.