Transcription of ICAO Carbon Emissions Calculator Methodology Version 11
1 ICAO Carbon Emissions Calculator Methodology Version 11. June 2018. Table of Contents 1 INTRODUCTION .. 3. 2 METHODOLOGICAL APPROACH .. 3. GENERAL DESCRIPTION OF THE Methodology .. 3. 3 CALCULATION PROCEDURE .. 4. 4 DATA SOURCES .. 7. FUEL DATA .. 7. TRIP DISTANCE .. 7. AIRCRAFT TYPE .. 8. PASSENGER LOAD FACTOR AND PASSENGER TO CARGO FACTOR .. 8. CABIN class .. 9. 5 DISCUSSION OF SENSITIVITIES .. 9. 6 MAINTENANCE REQUIREMENTS OF THE ICAO Methodology .. 10. 7 OPTIONS FOR CARRIER SPECIFIC ACCURACY IMPROVEMENTS .. 10. APPENDIX A: LOAD FACTORS BY ROUTE GROUP .. 12. APPENDIX B: EQUIVALENT AIRCRAFT MAPPING (BASED ON AIRCRAFT CURRENTLY IN-SERVICE).. 14. APPENDIX C: ICAO FUEL CONSUMPTION TABLE .. 17. APPENDIX D: AIRPORT CODES MAPPED TO CITY CODES .. 24. 2. 1 Introduction This document presents a general Methodology developed for estimating the amount of Carbon Emissions (CO2) generated by a passenger in a flight, for use in Carbon offsetting programmes.
2 It provides information on the methodological approach and details the assumptions underlying the generic factors employed by the ICAO Carbon Emissions Calculator . The Methodology is provided in an open source format facilitating individual air carriers that may wish to customize it with their own data. The document includes a general description of the method adopted by ICAO in order to estimate the CO2 Emissions of a flight (Item 2); the detailed calculation process implemented by the ICAO Calculator (Item 3); a description and analysis of the data inputs used (Item 4); a demonstration of the data coverage and sensitivity (Items 5 and 6); and the steps needed to be taken by a company wishing to customize the Calculator with its own data set (Item 7). 2 Methodological Approach The ICAO Methodology employs a distance-based approach to estimate an individual's aviation Emissions using data currently available on a range of aircraft types.
3 In order to implement this Methodology , ICAO has developed formula regarding fuel consumption and it is committed to continuously monitor and seek improvements in the data used, in order to obtain better Emissions estimation. The ICAO Methodology has been designed to require a minimum amount of input information from the user regarding the particulars of the flight concerned. It employs industry averages for the various factors which contribute to the calculation of the Emissions associated with the individual passenger's air travel. As passengers' aviation Emissions are affected by continuously changing variables specific to each flight, it is necessary to develop average factors to account for the effect of these flight parameters. While these factors cannot be captured on a flight-specific basis, this Methodology considers them for the purpose of developing a more robust estimation of flight Emissions and educating the public and the industry as to how these factors affect an individual passengers' emission intensity.
4 General Description of the Methodology The ICAO Carbon Emission Calculator requires that the user input the airports of origin and destination for a direct through flight ( a flight which does not have a change of the flight number). This is then compared with the published scheduled flights to obtain the aircraft types used to serve the two airports concerned and the number of departures per aircraft. Each aircraft is then mapped into one of the 312 equivalent aircraft types in order to calculate the fuel consumption for the trip based on the great circle distance between the airports involved in the journey. The passenger load factors, and passenger to cargo ratios, obtained from traffic and operational data collected by ICAO, are then applied to obtain the proportion of total fuel used which can be attributed to the passengers carried. The system then calculates the average fuel consumption for the 3.
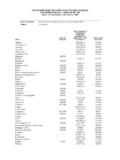
5 Journey weighted by the frequency of departure of each equivalent aircraft type. This is then divided by the total number of economy class equivalent passengers, giving an average fuel burn per economy class passenger. The result is then multiplied by in order to obtain the amount of CO2 footprint attributed to each passenger travelling between those two airports. 3 Calculation Procedure ICAO used this Methodology to develop a Carbon Emissions Calculator using a database constructed from several data sources. From the diagram below, we identify the following information used as input to the Calculator : GCD Fuel/Km ICAO. GISLoc Ind & LID Corinair ICAO Fuel Formula 2 5. Equivalent User City Pair Fuel Burn CO2/Y-pax Aircraft Input 1 AMSD. OAG 4 Corinair ICAO Fuel Formula 7 Computation 8 Computation 3 6. Load Cabin 9 10 # Pax # Y-Seats class factors Input Manuals Manuals/ Input ICAOTFS. data Manuals 11.
6 CO2. Emission Emission Output City Pair: Obtained from the airlines multilateral schedules database (AMSD). The flight schedule data are based on the latest available information and are updated annually. GCD (Great Circle Distance): The distance between origin and destination airports is derived from latitude and longitude coordinates originally obtained from ICAO Location Indicators database. Load Factors: The average generic factors considered for the purpose of this calculation are sourced from the Traffic by Flight Stage database (TFS) which collects air carrier city- pair specific traffic data by aircraft type produced on an annual basis, and domestic traffic and operational data, both collected by ICAO, as well as data based on the flight schedules published by the air carriers. Fuel/Km: This information, per equivalent aircraft model, is obtained from the ICAO Fuel Consumption Formula. 4. Y-seats: This is the number of economy seats that can be fit inside the equivalent aircraft.
7 ICAO made use of a standard cabin layout (in terms of location of galleys, toilets and exits). for each reference aircraft. This fixed space was then fitted with an all-economy seating using a pitch of about 31/32 inches (79/81 cm). This seating configuration was then compared with a mixed configuration involving business and/or first class row/seat combinations where, for the large wide bodied aircraft, business class seats have a 38. inch pitch, and those in first class have a 60 inch pitch. Examples of these layouts were obtained from the Manual on Airplane Characteristics for Airport Planning published on the Web by the aircraft manufacturers. In simple terms, the general Methodology used by the ICAO Calculator can be described with the following steps, with references to the diagram above: User input (1) The user enters the origin and destination airports. The database is searched for all flights, direct or non-direct, serving that city-pair.
8 However, the tool does not compute total Emissions for journeys with different flight numbers (connecting flights). To do this, the user can choose to build a total by calculating each of the journey legs separately and adding them up. Code share flights are treated as a single flight. This avoids a possible double counting of flight departures that would otherwise affect the calculations. The origin and destination database includes individual routings for single flight numbers with multiple stops. Hence the passenger does not need to know, nor input the full itinerary of the flight. Trip distance (2) The ICAO Location Indicators database contains the longitude and latitude coordinates for the airports. From these coordinates the Great Circle Distance (GCD)1 is then calculated and corrected by a factor depending on the distance between the two airports concerned (see section ). Traffic data (3) A passenger load factor is assigned to the user-defined city-pair, based on the passenger load factor for the corresponding route groups.
9 Load factor information is obtained from the database, based on 53 international route groups plus 11 domestic areas plus 11 intra areas (see Appendix A). Aircraft mapping (4) From the scheduled flights database, the scheduled aircraft is identified and linked to the aircraft fuel consumption database based on ICAO Fuel Consumption Formula. When the scheduled aircraft is not in the database, the aircraft is mapped into one of the 312 equivalent aircraft types existing in the aircraft fuel consumption database. Appendix B provides details of how this mapping was done. This allows estimation of the total fuel use on each route serving the user-defined city-pair. Fuel burn data (5) The fuel burn to flight distance relationship is extrapolated from the ICAO Fuel Consumption Formula. The factors considered include passenger load factor, flight distance, block time, the proportion of the overall payload represented by passenger traffic, cabin class flown, and type of equivalent aircraft flown.
10 The amount of fuel used on 1. The Great Circle Distance it is the shortest path between two points on the surface of a sphere 5. a route is the weighted average of total fuel burnt based on the frequencies of the scheduled aircraft types flown. Economy class (Y) seat capacity (6) From cabin floor plans obtained from the Manual on Airplane Characteristics for Airport Planning , which is developed by manufacturers to provide necessary data to airport operators and airlines for airport facilities planning, the maximum number of Y-seats that can be fitted per equivalent aircraft is determined. This virtual all economy configuration later allows the computation of cabin class factors (steps 9 & 10). CO2 per economy passenger (7 and 8) Using the trip distance, equivalent aircraft fuel consumption, passenger to seat load factor and passenger to freight load factor for the route group, and the number of Y-seats, the Methodology calculates the CO2 associated to each passenger, as follows: CO2 per pax = * (total fuel * pax-to-freight factor)/(number of y-seats * pax load factor).