Transcription of ICE Benchmark Administration Calculation of ICE Swap …
1 ICE Benchmark Administration , 2020 ICE Benchmark Administration Calculation of ICE Swap Rate from Tradeable Quotes Overview The ICE Swap Rate Benchmark represents the mid-price for interest rate swaps (the fixed leg), in various currencies and tenors and at particular times of the day. ICE Swap Rate is calculated off tradeable quotes from regulated, electronic, multilateral trading venues. In essence, the new Calculation works out what mid-price you would get if you were to fill a trade of Standard Market Size1 using the best prices available on the trading venues at the relevant times and in the relevant currencies and tenors. This document describes the new Calculation . This methodology is reviewed by the ICE Swap Rate Oversight Committee as documented in its Terms of Reference. The frequency of reviews is set by the Oversight Committee through its Calendar of Agenda Items. Structure Abbreviations VWB Volume Weighted Bid VWO Volume Weighted Offer VWAMP Volume Weighted Average Mid Price SMS Standard Market Size, the volume for the standardised trade to be filled1 1 The filling is a theoretical filling done as part of the Calculation ; the administrator does not actually trade in the market.
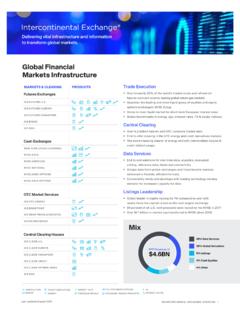
2 Standard Market Sizes are different for each currency and tenor, and are detailed in Appendix 1 Trading Counterparties Tradeable quotes ICE Swap Rate Benchmark Regulated, Electronic Trading Venues Administrator (IBA) Benchmark Users Order book data ICE Benchmark Administration , 2020 Key features of the Calculation VWAMPs from Synthetic Order Books at Snapshots in Time: the Calculation is based on finding the VWAMP from theoretically filling a trade in SMS on both the bid and offer side at a particular instant in time (a snapshot). At each snapshot, we combine the order books from all the trading venues to create a synthetic order book that represents the best prices (and accompanying volumes) available in the market at that time. We then calculate the volume weighted prices at which you could fill a trade in SMS from this synthetic order book on both the bid and offer side and these effective prices are used to calculate the VWAMP.
3 Multiple Snapshots: instead of using just one snapshot at a pre-determined time to create the VWAMP, IBA uses multiple, randomised snapshots taken in a short window before the Calculation . This makes the Benchmark more robust against attempted manipulation and momentary aberrations in the market. Liquidity Checks: illiquid snapshots are not included in the Calculation any snapshots that can t fill the SMS (on both the bid and offer side) are discarded, so only VWAMPs from reasonably sized trades are included in the Calculation . A minimum number of liquid snapshots is required to perform the Calculation . Crossed and Zero Spread snapshots are also discarded. Outlier Checks: to protect against momentary and unrepresentative spikes in price, outlier snapshots are not included in the Calculation . The snapshots that pass the liquidity checks are ranked in order of their VWAMPs and the snapshots higher than the 75th percentile and lower than the 25th percentile are discarded leaving only the most representative snapshots.
4 Quality Weighting: IBA combines the remaining VWAMPs into a final price (ICE Swap Rate) using a quality weighting. Snapshots with tighter spreads between the VWB and VWO are indicative of a better quality market so are given a higher weighting. Movement Interpolation: Where there are not enough liquid snapshots to calculate the rate for a tenor, the day-on-day move in adjacent tenors and the previous day s rate for the tenor are used to interpolate a rate (provided certain conditions are met). Step by Step Calculation The Calculation has 5 steps: 1. Take multiple snapshots, create a synthetic order book for each snapshot and calculate each VWAMP 2. Discard illiquid or crossed/zero spread snapshots If there are enough liquid snapshots: 3. Discard outlier snapshots 4. Quality-weight the remaining snapshots (VWAMPs) to give the ICE Swap Rate If there are not enough liquid snapshots: 5.
5 Use movement interpolation to give the ICE Swap Rate (provided certain conditions are met) ICE Benchmark Administration , 2020 Step 1: Take multiple snapshots, create a synthetic order book for each snapshot and calculate each VWAMP IBA collects data for a two minute window in the run up to an ICE Swap Rate Calculation ( 10:58am to 11:00am). This data contains the tradeable prices and volumes that were available on the trading venues during the window. To generate the randomised snapshot times, the Calculation divides the two minute window into 24 blocks of 5 seconds each and generates a random snapshot time (to the nearest millisecond) in each of these 5 second blocks. This ensures that there is adequate spacing between most of the snapshots because, while any two snapshots could randomly be close together (either side of a block boundary ), three snapshots can t all be close to each other (there will always be a whole 5 second block separating the outer two).
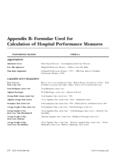
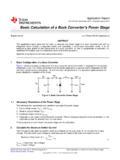
6 So the snapshots will be spaced appropriately through the window. At each snapshot time we create a synthetic order book from all of the prices and volumes that were tradeable across any venue at that moment in time. We rank the bids and offers by price and use these quotes to calculate what the VWB, VWO and VWAMP would be if you were to fill a trade of SMS. The below example assumes a standard market size of 50 million, taking data from three trading venues at one snapshot time (for one currency and tenor, and only showing the top 5 price levels from each venue)2: Generating the synthetic order book from one snapshot: Trading Venue 1 Trading Venue 2 Bid Offer Bid Offer Vol (m) Price Price Vol (m) Vol (m) Price Price Vol (m) 16 30 32 17 32 49 40 19 13 28 17 31 23 50 39 30 37 44 33 28 Trading Venue 3 Synthetic Order Book Bid Offer Bid Offer Vol (m) Price Price Vol (m) Vol (m) Price Price Vol (m) 19 23 32 23 35 26 16 30 36 40 19 17 39 42 35 49 49 44 32 19 2 We use the full granularity of each price during the Calculation and we round the final output to three decimal places for the publication of the final ICE Swap Rate.
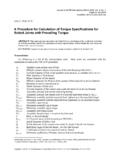
7 To simplify the example we are only showing granularity to 4 decimal places during the Calculation . Order taken from venue 1 Order taken from venue 3 Order taken from venue 3 ICE Benchmark Administration , 2020 From this Synthetic Order Book we then identify the price levels that cumulatively allow us to fill the Standard Market Size (in this case 50m): Identifying the volumes and price levels to use to simulate filling an order of SMS: Synthetic Order Book Bid Offer Vol used for SMS (m) Vol (m) Price Price Vol (m) Vol used for SMS (m) 32 32 23 23 16 16 30 27 2 19 17 35 49 32 19 Price level used in filled trade of SMS We then simulate filling an order of SMS ( 50m) by calculating the volume weighted prices on the bid and offer side (VWB and VWO) using the volumes and price levels that we identified. In this case: = 3250 + 1650 + 250 = = 2350 + 2750 = And the VWAMP is the mid-point of the Volume Weighted Bid and Volume Weighted Offer: = + = So for this snapshot: VWB = VWO = VWAMP = ICE Benchmark Administration , 2020 We repeat this process of creating a synthetic order book and calculating the VWAMP for each of the 24 snapshot times: Snapshot Time VWB VWO VWAMP 10:58 02s 125ms 10:58 07s 145ms 10:58 12s 568ms 10:58 19s 821ms 10:58 20s 125ms 10:58 28s 855ms 10:58 31s 005ms 10:59 38s 599ms 10:58 44s 525ms 10:58 47s 519ms 10:58 52s 325ms 10:58 59s 029ms 10:59 00s 119ms 10:59 07s 009ms 10:59 10s 519ms 10:59 19s 259ms 10:59 21s 619ms 10:59 26s 259ms 10:59 32s 951ms 10:59 35s 324ms 10.
8 59 42s 756ms 10:59 49s 999ms 10:59 53s 267ms 10:59 59s 324ms Step 2: discard illiquid snapshots Sometimes it is not possible to fill the SMS because there is not enough volume tradeable at that snapshot time. The Calculation discards these snapshots. For our worked example assume that the snapshots at 10:58 31s 005ms and 10:59 07s 009ms did not in fact have enough volume to fill the SMS and therefore couldn t have a VWAMP calculated from them. The Calculation now has 22 remaining snapshots to use in step 3. Check that there are enough liquid snapshots We then check to see if there are enough liquid snapshots to generate a rate from. If there are 6 or more liquid snapshots then the Calculation continues to steps 3 and 4. If not, it tries to generate a rate using movement interpolation (step 5). ICE Benchmark Administration , 2020 Step 3: discard outlier snapshots To protect against momentary and unrepresentative spikes in the price, the Calculation removes outlying snapshots.
9 To do this, the Calculation ranks the snapshots that passed the liquidity checks according to their VWAMPs and any snapshots with a VWAMP greater than the 75th percentile or less than the 25th percentile are removed from the Calculation . In this example, the 25th percentile is and the 75th The remaining snapshots are those that have passed the liquidity check and that also have a VWAMP that is between and From our 24 original snapshots, 2 failed the liquidity check, and 11 were excluded by the outlier check, leaving 11 remaining for the final Calculation as shown below: Snapshot Time VWB VWO VWAMP Liquidity Check Outlier Check 10:58 02s 125ms Pass Fail 10:58 07s 145ms Pass Pass 10:58 12s 568ms Pass Fail 10:58 19s 821ms Pass Pass 10:58 20s 125ms Pass Pass 10:58 28s 855ms Pass Fail 10:58 31s 005ms Fail N/A 10:59 38s 599ms Pass Pass 10:58 44s 525ms Pass Pass 10:58 47s 519ms Pass Fail 10:58 52s 325ms Pass Fail 10:58 59s 029ms Pass Fail 10:59 00s 119ms Pass Fail 10:59 07s 009ms Fail N/A 10:59 10s 519ms Pass Pass 10.
10 59 19s 259ms Pass Pass 10:59 21s 619ms Pass Fail 10:59 26s 259ms Pass Fail 10:59 32s 951ms Pass Fail 10:59 35s 324ms Pass Pass 10:59 42s 756ms Pass Pass 10:59 49s 999ms Pass Fail 10:59 53s 267ms Pass Pass 10:59 59s 324ms Pass Pass Step 4: quality-weight the remaining snapshots to give the ICE Swap Rate: The ICE Swap Rate is the quality-weighted average of the remaining VWAMPs. Quality is measured for each snapshot by the tightness of the spread between VWB and VWO. A tighter spread means ICE Benchmark Administration , 2020 that the VWAMP for that snapshot is a more reliable indication of being able to fill standard market size at a price close to that VWAMP. The Calculation combines the remaining VWAMPs using a weighted average with the inverse of the spreads as the weighting factor. In the example, this gives: Snapshot Time VWB VWO VWAMP Spread Weighting 10:58 07s 145ms 5% 10:58 19s 821ms 6% 10:58 20s 125ms 9% 10:59 38s 599ms 36% 10:58 44s 525ms 3% 10:59 10s 519ms 13% 10:59 19s 259ms 2% 10:59 35s 324ms 8% 10:59 42s 756ms 4% 10:59 53s 267ms 8% 10:59 59s 324ms 7% Summing the weighted VWAMPs gives the final ICE Swap Rate: ICE Swap Rate (full granularity) = ICE Swap Rate (3dp for publication) = Step 5: Use movement interpolation If there were not enough liquid snapshots after step 2 then the Calculation will try to use movement interpolation to generate the ICE Swap Rate.