Transcription of Illicit Drug Toxicity Deaths in BC - British Columbia
1 Ministry of Public Safety & Solicitor General Posting Date February 09, 2022 Page 1 of 26 Illicit Drug Toxicity Deaths in BC January 1, 2011 december 31, 2021 This report summarizes all unintentional Illicit drug Toxicity Deaths in British Columbia (accidental and undetermined) that occurred between January 1, 2011, and december 31, 2021, inclusive. It includes confirmed and suspected Illicit Toxicity Deaths (inclusion criteria below). Please note that data is subject to change as investigations are Inclusion Criteria: The Illicit drug Toxicity category includes the following: Street drugs (Controlled and illegal drugs: heroin, cocaine, MDMA, methamphetamine, Illicit fentanyl etc.)
2 Medications not prescribed to the decedent but obtained/purchased on the street, from unknown means or where origin of drug not known. Combinations of the above with prescribed medications. 2021 Summary In November and december 2021, there were 210 and 215 suspected Illicit drug Toxicity Deaths , respectively. These are the two largest numbers of suspected Deaths ever recorded in a month. In 2021, there were 2,224 suspected Illicit drug Toxicity Deaths , the most ever recorded in a year. This represents a 26% increase over the number of Deaths seen in 2020 (1,767). The number of Illicit drug Toxicity Deaths in November and december 2021 equates to about 7 Deaths per day.
3 Overall, in 2021, there were on average Deaths per day. In 2021, 71% of those dying were aged 30 to 59, and 78% were male. The townships experiencing the highest number of Illicit drug Toxicity Deaths in 2021 are Vancouver, Surrey, and Victoria. By Health Authority (HA), in 2021, the highest numbers of Illicit drug Toxicity Deaths were in Fraser and Vancouver Coastal Health Authorities (765 and 615 Deaths , respectively), making up 62% of all such Deaths during this period. By Health Authority (HA), in 2021, the highest rates were in Vancouver Coastal Health (49 Deaths per 100,000 individuals) and Northern Health (48 per 100,000). Overall, the rate in BC is 43 Deaths per 100,000 individuals in 2021.
4 By Health Service Delivery Area (HSDA), in 2021, the highest rates were in Vancouver, Thompson Cariboo, Northwest, Northern Interior, and Fraser East. By Local Health Area (LHA), in 2021, the highest rates were in Upper Skeena, Merritt, Enderby, Lillooet, and North Thompson. In 2021, 83% of Illicit drug Toxicity Deaths occurred inside (56% in private residences and 28% in other residences including social and supportive housing, SROs, shelters, and hotels BC Coroners Service Illicit Drug Toxicity Deaths in BC January 1, 2011 to december 31, 2021 Posting Date February 9, 2022 Page 2 of 26 and other indoor locations) and 15% occurred outside in vehicles, sidewalks, streets, parks, etc.
5 In Vancouver Coastal, other residences (47%) were the most common place of Illicit drug Toxicity Deaths followed by private residences (36%) between 2018 and 2021 (see Table 3, Page 5). No Deaths have been reported at supervised consumption or drug overdose prevention There is no indication that prescribed safe supply is contributing to Illicit drug Deaths . Trends Male Illicit drug Toxicity death rates have remained at a high rate. Female rates have trended higher in recent months (see Figure 4, Page 8). Illicit drug Toxicity death rates among 19+ years have remained high, while rates among 0-18 years remain stable (see Figure 6, Page 10).
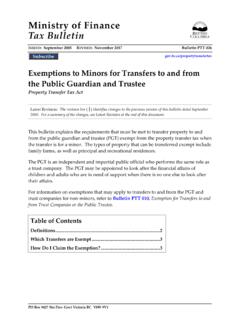
6 The proportion of Deaths that are 50+ years of age has steadily increased year after year for the past 6 years. In 2021, 38% of Deaths were 50 years or over (see Figure 5, Page 9). Illicit drug Toxicity death rates for all health authority rates remain high (see Figure 7, Page 13). BC Coroners Service Illicit Drug Toxicity Deaths in BC January 1, 2011 to december 31, 2021 Posting Date February 9, 2022 Page 3 of 26 '95'96'97'98'99'00'01'02'03'04'05'06'07' 08'09'10'11'12'13'14'15'16'17'18'19'20' Rate per 100,000 1: Illicit Drug Toxicity Deaths and Death Rate per 100,000 Population [3,5] BC Coroners Service Illicit Drug Toxicity Deaths in BC January 1, 2011 to december 31, 2021 Posting Date February 9, 2022 Page 4 of 26 Table 1.
7 Illicit Drug Toxicity Deaths by Month, British Columbia , 2011-2021[3] Month 2011 2012 2013 2014 2015 2016 2017 2018 2019 2020 2021 Jan 24 20 20 23 43 85 148 134 94 80 188 Feb 24 17 21 38 31 58 124 108 85 78 173 Mar 25 25 33 28 32 76 130 159 119 119 172 Apr 27 31 31 29 34 72 154 135 82 128 184 May 22 19 28 40 41 51 149 118 88 180 171 Jun 22 25 25 29 34 71 129 116 74 188 169 Jul 33 29 39 25 40 74 122 149 72 185 196 Aug 22 20 21 37 53 65 128 124 84 162 194 Sep 22 16 28 32 50 63 97 139 62 143 153 Oct 23 19 19 35 53 77 98 119 79 176 199 Nov 27 28 31 28 52 140 112 131 81 166 210 Dec 24 21 38 25 66 161 104 127 62 162 215 Total 295 270 334 369 529 993 1,495 1,559 982 1,767 2.
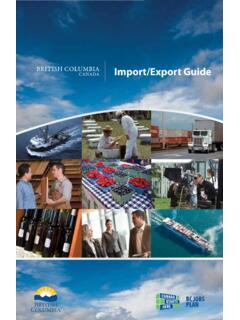
8 224 Average Comparison to Other Common Causes of Unnatural Deaths from 2010 to 2020: *Data is preliminary and subject to change. Prescription drug Toxicity Deaths (accidental and undetermined) include cases where only a prescription drug is involved and reported for closed investigations only to 2019. 0200400600800100012001400160018002000201 0201120122013201420152016201720182019202 0 DeathsFigure 2: Major Causes of Unnatural Deaths in BCIllicit DrugSuicideMotor vehicle incidentHomicidePrescription Drug BC Coroners Service Illicit Drug Toxicity Deaths in BC January 1, 2011 to december 31, 2021 Posting Date February 9, 2022 Page 5 of 26 BC Data by Place of Injury Table 2: Illicit Drug Toxicity Deaths by Place of Injury, BC, 2018-2021[3] 2018 2019 2020 2021 Inside.
9 Private Residence 927 ( ) 566 ( ) 1,002 ( ) 1,235 ( ) Other Residence 377 ( ) 259 ( ) 461 ( ) 554 ( ) Correctional facility/police cell 5 ( ) 4 ( ) 5 ( ) 8 ( ) Medical facility 5 ( ) 5 ( ) 5 ( ) 9 ( ) Occupational site 6 ( ) 6 ( ) 6 ( ) 8 ( ) Public building Public washroom 23 ( ) 11 ( ) 6 ( ) 12 ( ) Other area of building 17 ( ) 7 ( ) 13 ( ) 28 ( ) Outside 189 ( ) 117 ( ) 250 ( ) 336 ( ) Unknown 10 ( ) 7 ( ) 19 ( ) 34 ( ) Total 1,559 982 1,767 2,224 Table 3: Illicit Drug Toxicity Deaths by Place of Injury and Health Authority, BC, 2018-2021[3] Interior Fraser Vancouver Coastal Vancouver Island Northern Inside: Private Residence 658 ( ) 1,546 ( ) 656 ( ) 587 ( ) 283 ( ) Other Residence 203 ( ) 263 ( ) 859 ( ) 240 ( ) 86 ( ) Other Inside 36 ( ) 84 ( ) 39 ( ) 17 ( ) 13 ( ) Outside 126 ( ) 286 ( ) 259 ( ) 158 ( ) 63 ( ) Unknown 12 ( ) 22 ( ) 22 ( ) 11 ( ) 3 ( ) Total 1,035 2,201 1,835 1,013 448 Private Residence includes driveways garages, trailer homes and either decedent s own or another s residence.
10 Other Residence includes hotels, motels, rooming houses, SRO (single room occupancy, shelters, social/supportive housing etc.) Medical facility includes hospitals, community care facilities, etc Occupational site includes locations where the decedent was at their place of work. Public buildings includes restaurants, community centres, businesses, clinics, etc. Outside includes vehicles, streets, sidewalks, parking lots, public parks, wooded areas, and campgrounds BC Coroners Service Illicit Drug Toxicity Deaths in BC January 1, 2011 to december 31, 2021 Posting Date February 9, 2022 Page 6 of 26 BC Data by Drugs Involved: Preliminary data suggests that the proportion of Illicit drug Toxicity Deaths for which Illicit fentanyl was detected (alone or in combination with other drugs) was approximately 83% in 2021 and 85% in 2020.