Transcription of IMAGE PROCESSING AND DATA ANALYSIS - Horia …
1 IMAGE PROCESSING AND data ANALYSISIN COMPUTED TOMOGRAPHY E. D. SELE CHI1, O. G. DULIU21 University of Bucharest, Faculty of Physics, Romania2 University of Bucharest, Department of Atomic and Nuclear Physics, M gurele, Box, MG-11, RO-077125, Bucharest, RomaniaReceived September 12, 2006 Computed Tomography (CT) is a non-invasive technique to provide CTimages of every part of the human body without superimposition of adjacentstructures. Measurements with X-ray CT are subject to a variety of imperfections orimage artifacts including: quantum noise, X-ray scattering by the patient, beamhardening and nonlinear partial volume effects. IMAGE PROCESSING with AdobePhotoshop, ImageJ, Corel PHOTO-PAINT and Origin software has been used inorder to achieve good quality images for quantitative ANALYSIS . IMAGE enhancementtechnique allows the increasing of the signal-to-noise ratio and accentuates imagefeatures by modifying the colors or intensities of an IMAGE .
2 It also includes linear andnonlinear filtering, deblurring and automatic contrast enhancement. Statisticalfunctions enable to analyze the general characteristics of a neuroimage by displayingthe IMAGE histogram or plotting the profile of intensity values. data ANALYSIS of CTimages can help distinguish between a neurological disease, a common disorder likeMajor Depression (MD) or Obsessive-Compulsive Disorder (OCD) and a INTRODUCTIONC omputed Tomography (CT) is an imaging technique where digitalgeometry PROCESSING can be used to generate a 3D- IMAGE of brain s tissue andstructures obtained from a large series of 2D X-ray images. X-ray scans furnishdetailed images of an object such as dimensions, shape, internal defects anddensity for diagnostic and research purposes. Supposing that we have a verynarrow pencil beam of monochromatic X rays which traverse an inhomogeneousmedium and no scattered radiation reaching the detector, the transmittedintensity can be written [2, 3]:() ()[]()0exp,lIx Ixxydy = (1) Paper presented at the 7th International Balkan Workshop on Applied Physics, 5 7 July2006, Constan a, Journ.
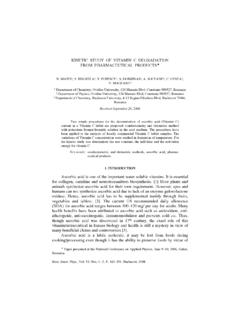
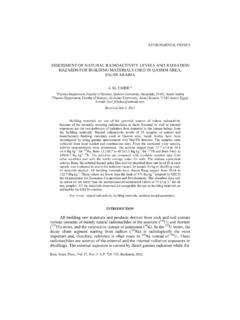
3 Phys., Vol. 52, Nos. 5 7 , P. 667 675, Bucharest, 2007668E. D. Sele chi, O. G. Duliu2where I0(x ) is the unattenuated intensity, and x define the position of themeasurement, [x, y] is the two-dimensional distribution of the linearattenuation coefficient, l is the straight line joining the source and detector. TheX-ray source and detector rotate with the x y frame and the X-rays travel parallelto y . Projection (Radon Transform) of the object ( )x is defined as [1, 6]:()() ()[]0ln,lxIxIx xydy = = (2)The object is represented as a two-dimensional distribution of linearattenuation coefficient [x, y] (Fig. 1).Fig. 1 The x y frame is rotated by angle with respect to the xyframe. The origin of both systems is positioned at the centrerotation of the scanning gantry and P is the general point in CT scanners the X-ray attenuation according to equation (1) is measuredalong a variety of lines within a plane perpendicular to the long axis of thepatient with the goal of reconstructing a map of the attenuation coefficients H forthis plane [3].
4 The resulting attenuation coefficients, in Hounsfield units areusually expressed with reference to water:tissuewaterwater1000 = H (3)Small differences in H can be amplified visually by increasing the contrastof the a third generation fan beam X-ray tomography machine a point source ofX-rays and a detector array are rotated continuously around the patient. Datacollection time for such scanners ranges from 1 to 20 seconds. A specialcomputer program calculates the values of density and creates cross-sectionalimages of the brain. Modern CT scanner can acquire data in a continuous helical3 IMAGE PROCESSING and data ANALYSIS in computed tomography669or spiral fashion [5], shortening acquisition time and reducing artifacts such as:quantum noise, X-ray scattering by the patient, beam hardening and nonlinearpartial volume effects [4].
5 IMAGE imperfections can also be caused by insufficientcalibration of detector sensitivity, inadequacies in the reconstruction algorithm,non-uniformity scanning motion, fluctuation in X-ray tube voltage, paper carry-out our results concerning the X-ray CT IMAGE processingand data ANALYSIS by displaying Histograms, Profile Plots, Power Spectra usingFast Fourier Transformations (FFT) algorithm, 3D Color Surface Graphs andfeatures of abnormal tissue CT INSTRUMENTATION AND COMPUTER SOFTWAREC omputed Tomography uses an X-ray tube, an elaborate radiation detectionsystem and a computer that assembles the measurement data into a series oftransversal slice of the subject s body. The X-ray CT images of the brain wereperformed by using a Siemens Sensation 4 VA47 PROCESSING and data ANALYSIS were performed by using ImageJ,Adobe Photoshop , Corel PHOTO-PAINT and OriginPro is a public domain Java IMAGE PROCESSING program suitable to measuredistances and angles, to calculate area and pixel value statistics of user-definedselections and to provide density histograms and line profile plots.
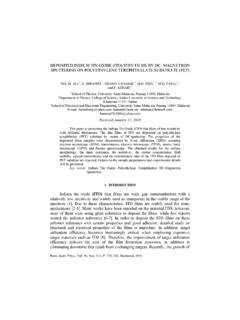
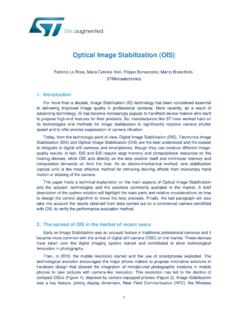
6 AdobePhotoshop IMAGE PROCESSING software has been used in conjunction withCorel PHOTO-PAINT programs to improve the CT images by adjusting andcreating special effects. OriginPro is a specialized program for data analysisproviding FFT ANALYSIS , Profile Plots and 3D Color Maps Surface of CT RESULTS AND IMAGE PROCESSINGI mage PROCESSING techniques can help to differentiate the abnormal tissuegrowth (tumors) in question from other tissues, providing more detailedinformation on head injuries, stroke, brain disease and internal structures than doregular X-ray CT scans. By using suitable programs into the first stage weperformed multiple PROCESSING on a typical tomographic IMAGE of a normal brain S1 (Subject 1 Fig. 2a) and two X-ray CT scans of an abnormal brain S S which belong to the same subject S2 (Fig.)
7 2c, e).The Contrast Enhancement filter has been used to adjust the tone, color andcontrast in the X-ray CT images. The Threshold setting changes pixel contrast,which can reduce or eliminate visible dust particles and other tiny marks. Theradius setting enables you to control the number of pixels involved in the smoothing5 IMAGE PROCESSING and data ANALYSIS in computed tomography671effect that is applied. Threshold adjustment converts all colors to either black orwhite based on their brightness values (Fig. 2b, d, f). The Histogram Equali-zation filter was applied to redistribute the balance of shadows, midtones andhighlights in the composite channel or in individual color channels. In order tohighlight the edges in the X-ray CT IMAGE of normal brain we have been appliedthe Variance filter (radius 5) from ImageJ process menu.
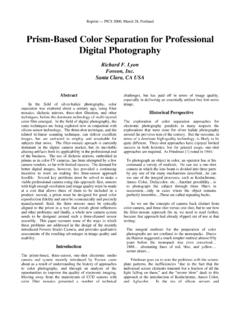
8 For clarity someregions are made transparent while the significant details can be easily Photoshop filters used in conjunction with Corel PHOTO-PAINT PROCESSING enable to apply automated effects to an IMAGE , allowing us to correctlighting and perspective fluctuations, increasing the focus of an IMAGE andadding depth to RGB X-ray CT IMAGE . Psychedelic effect was used to shift anentire RGB IMAGE from one color range to another. Contour filters detect andaccentuate the edges of objects and selections in the X-ray CT IMAGE of thenormal brain. By using the Invert filter after Trace Contour process weconverted every color in the X-ray CT IMAGE to its exact opposite (Fig. 3).Hue represents color, saturation indicates the color depth or richness andlightness shows the overall percentage of white in the X-ray CT images.
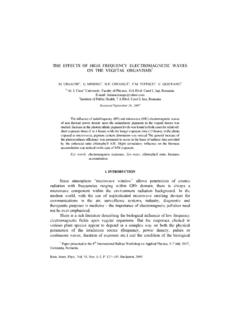
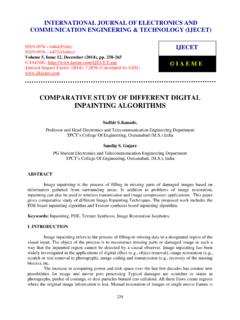
9 BrushStrokes filter can be also use to emphasize the edges of the objects. Theabnormal tissues are clearly visible after the CT IMAGE data ANALYZE AND INTERPRETATIONSBy using ImageJ software we have been performed Histograms, ProfilePlots and Particle ANALYSIS for X-ray CT scans of S2 abnormal illustrates the number of pixels distributed on X-ray CT IMAGE (y-axis) for each level (gray value) from darkest (0) to brightest (256). The totalpixel count was also calculated and displayed, as well as the mean, modal,minimum and maximum gray value by using ImageJ program (Fig. 5a, b). Countindicates the total number of pixels corresponding to the intensity level. Mean( for and for ) shows the average intensity value. It is thesum of the gray values of all the pixels in our selection divided by the number ofpixels.
10 With RGB (24-bit) X-ray CT images, the mean was calculated byconverting each pixel to gray scale by using the formula: gray = red ++ green + blue. Std Dev (Standard Deviation) with the and for and respectively, indicates how widely intensityvalues vary. Min (0) and Max (255) represents the minimum and maximum grayvalues within the X-ray CT images. The Mode (Modal gray value: 2 and 10attributed to and respectively) was computed as the midpoint of thehistogram interval with the highest Analyze command counts and measures objects in binary orthreshold images. Once the IMAGE has been segmented we can obtain variousinformation regarding particle size and numbers. By using ImageJ software we672E. D. Sele chi, O. G. Duliu6 Fig. 5 ImageJ histograms of X-ray CT abnormal brain scans.