Transcription of Impact of COVID-19 on the Local Jail Population, January ...
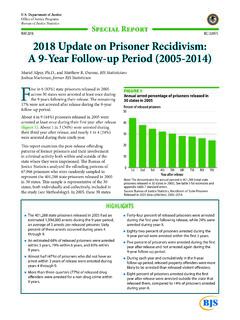
1 Department of Justice Office of Justice Programs Bureau of Justice StatisticsSpecial ReportMARCH 2021 NCJ 255888 Impact of COVID-19 on the Local jail Population, January -June 2020 Todd D. Minton, Zhen Zeng, , and Laura M. Maruschak, BJS StatisticiansLocal jails in the United States experienced a large decline (down 185,400 inmates ) in their inmate populations from June 30, 2019 to June 30, 2020, which can be attributed mainly to the COVID-19 pandemic (figure 1 and table 1). The inmate population confined in Local jails was 549,100 at the end of June 2020, down from 734,500 at the end of June 2019.
2 The midyear 2020 inmate population was the lowest since 1996, when 518,500 inmates were confined in Local jails (not shown in tables).The Impact of COVID-19 on Local jails began in March 2020, with a drop of 18% in the inmate population between the end of February and the end of March, followed by an 11% drop by the end of April. By the last weekday in April 2020, the number of jail inmates dropped to a low of 519,500. By the end of May 2020, the population increased about 3% and was up another 2% by the end of June decline in the inmate population since midyear 2019 resulted from both a reduction in admissions to jails and expedited releases in response to the COVID-19 pandemic from March to June 2020.
3 FIGURE 1 Number of inmates confined in Local jails on the last weekday in June 2019 and the last weekday of each month from January to June 2020 Number0100,000200,000300,000400,000500,0 00600,000700,000800,000 Jun 20 May 20 Apr 20 Mar 20 Feb 20 Jan 20 Jun 19//Note: See table 1 for counts and appendix table 1 for standard : Bureau of Justice Statistics, Census of Jails, 2019; and Annual Survey of Jails, From March to June 2020, about 208,500 inmatesreceived expedited release in response to COVID-19 . During the pandemic, jail facilities became lesscrowded, as indicated by the decrease in occupiedbed space from 81% at midyear 2019 to 60% at midyear 2020.
4 The number of inmates held for a misdemeanordeclined about 45% since midyear 2019, outpacingthe decline in the number of inmates held for a felony (down 18%). The percentage of inmates held for a felony increasedfrom 70% at midyear 2019 to 77% at midyear 2020. From March to June 2020, jails conducted 215,360inmate COVID-19 tests. More than 11% of these testswere positive. Jails in counties with confirmed residential COVID-19infection rates of 1% or more tested nearly 21%of persons admitted to their jails from March to June 2020.
5 From March to June 2020, nearly 5% (10,850) of alllocal jail staff (233,220) tested positive for OF COVIDfi19 ON THE Local jail POPULATION, January -JUNE 2020 | MARCH 2021 Local jails reported million admissions during the 12-month period ending June 30, 2020, which was about 16% lower than the million admissions during the 12-month period ending June 30, 2019 (appendix table 10).Findings in this report are based on the 2019 Census of Jails (COJ) and the 2020 Annual Survey of Jails (ASJ). The Bureau of Justice Statistics (BJS) periodically conducts the COJ, collecting a complete enumeration of Local jail facilities.
6 In the years between COJ administration, BJS conducts the ASJ, a national survey administered to a sample of 897 jail jurisdictions, to provide nationally representative statistics on the number and characteristics of Local jails, inmates , and staff. See Methodology for the ASJ sample special report is the first of two that describe the Impact of COVID-19 on the Local jail population. BJS will release a final report that will include results from July to December 1 Number of inmates confined in Local jails on the last weekday in June 2019 and the last weekday of each month from January to June 2020 Last weekday in NumberJune 2019*734,500 January 2020711,900 February 2020710,300 March 2020585,900 April 2020519,500 May 2020536,600 June 2020549,100 Note: See appendix table 1 for standard errors.
7 *Comparison month. Difference with comparison month is significant at the 95% confidence : Bureau of Justice Statistics, Census of Jails, 2019; and Annual Survey of Jails, Annual Survey of Jails Special Addendum on Coronavirus ( COVID-19 )In response to the COVID-19 pandemic, BJS added a special addendum to the 2020 and 2021 ASJ to measure the Impact of this public health emergency on Local jails. In designing the addendum, BJS solicited comments and suggestions from a correctional health expert and jail administrators regarding data availability and reporting capabilities; question design and order; and estimated burden.
8 Below is a summary of the questions from this survey. For the full questionnaire, go to #Questionnaires. Last weekday inmate counts for every month from January to May 2020. The number of inmates who received expedited release due to COVID-19 from March 1, 2020 to June 30, 2020. The number of COVID-19 tests conducted and the number of positive tests from January 1, 2020 to June 30, 2020. The number of unique individuals who tested positive for COVID-19 from March 1, 2020 to June 30, 2020. The number of staff who tested positive for COVID-19 from March 1, 2020 to June 30, 2020.
9 Total, confirmed, and suspected COVID-19 inmate deaths and staff deaths from March 1, 2020 to June 30, 2020. Number of total inmate and staff COVID-19 deaths that were based on a medical examiner s or coroner s evaluation (such as an autopsy, postmortem exam, or review of medical records).Terms and definitions COVID-19 Confirmed death Deaths where COVID-19 was the cause of death or a significant contributor of death as determined by a positive test for coronavirus before or after residents confirmed infection rate County-level confirmed COVID-19 cases as a percentage of the county test A viral test for coronavirus disease.
10 This is not a serology or antibody releases All inmates released to limit inmate risk and exposure, or due to coronavirus-related understaffing, court orders, and legislative death Deaths where coronavirus was the suspected cause of death or a significant contributor to the death, based on the person having symptoms of COVID-19 but no positive test for OF COVIDfi19 ON THE Local jail POPULATION, January -JUNE 2020 | MARCH 2021 Terms and definitions GeneralAdmissions All persons booked into and housed in jail facilities by a formal legal document and the authority of the courts or some other official agency, including repeat offenders booked on new charges and persons sentenced to weekend programs or entering the facility for the first time.