Transcription of Improving College and Career Readiness for Students with ...
1 College & Career . Readiness & SUCCESS Center at American Institutes for Research Improving College and Career Readiness for Students with disabilities This issue brief is intended to assist state policymakers in better understanding strategies to prepare Students with disabilities and special needs for College and Career . The brief provides context and background on the numbers of Students with disabilities who are College and Career ready; examines issues and strategies related to preparation and Readiness for postsecondary education and careers; and includes examples of current programs and policies that help Students with disabilities to successfully MARCH 2013 transition to College and Career .
2 Context and Background To meet the demands of the 21st century global economy, Americans must have a broader range of knowledge, skills, and abilities than ever before. The United States will need a much higher percentage of its young people including youth with disabilities to earn postsecondary credentials and degrees in order to compete in a global marketplace and to be productive citizens. According to a report from the Georgetown University Center on Education and the Workforce, current trends indicate that by 2018, the United States will need 22. million new College degrees but will fall short of that number by at least three million postsecondary degrees ( , associate degree or higher).
3 In addition, the United States will need at least million new workers with postsecondary Prepared for the College and certificates1 to meet labor-market demand (Carnevale, Smith, & Strohl, 2010). Career Readiness and Success As we work to increase the number of youth who are College and Career ready, Center (CCRS Center) by Betsy we must ensure that Students with disabilities are not left behind. We can do Brand and Andrew Valent, this by equipping them with the knowledge and skills to fulfill their individual American Youth Policy Forum, potential, compete with other workers, and lead full and independent lives.
4 A lead partner of the CCRS. Despite advances in Improving the College and Career Readiness of Students Center, and Dr. Louis Danielson, with disabilities , there is still a great deal to be done to help more Students American Institutes for Research 1. Postsecondary certificates are awards that are often occupationally focused and include awards from business, vocational, trade, and technical schools, as well as technical and non- degree awards from two- and four-year colleges (Carnevale, 2012). with disabilities complete high school, enter postsecondary education, earn a degree or certificate, and find employment that leads to independence, self-sufficiency, and civic engagement.
5 While considerable progress has been made during the last decade, Students with disabilities graduate from high school at lower rates than the general population. From 1996 97 to 2008 09, the percentage of youth ages 14 to 21 years old who were served under the Individuals with disabilities Education Act (IDEA)2 and who completed high school with a regular diploma rose from 43 percent to 61 percent. While these data cannot be equated to the overall high school average freshman graduation rate due to differences in counting Students , the average freshman graduation rate of percent in 2008 09 does provide a point of comparison (National Center for Education Statistics, 2011c).
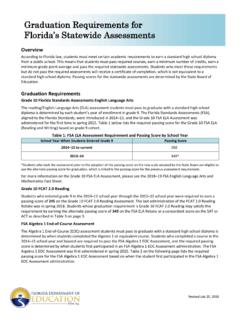
6 Table 1. National Longitudinal Transitions Studies I and II: Postseconday Enrollment Within Four Years Of High School 70%. 60% 50% 40%. 30% 20%. 10%. 0%. Youth with disabilities General Population Youth 1990 2005. Source: Newman, L., Wagner, M., Cameto, R. & Knokey, A. M. (2010). Comparisons across time of the outcomes of youth with disabilities up to 4 years after high school: A report of findings from the National Longitudinal Transition Study (NLTS) and the National Longitudinal Transition Study-2 (NLTS2) (NCSER 2010 3008). Menlo Park, CA: SRI International. Retrieved from ncser/pubs/20103008/ 2.
7 The Individuals with disabilities Education Act is a law ensuring services to children with disabilities throughout the nation. IDEA governs how states and public agencies provide early intervention, special education, and related services to more than million eligible infants, toddlers, children, and youth with disabilities . 2 Improving College and Career Readiness for Students with disabilities Students with disabilities also differ in type of postsecondary education enrollment. While Students in the National Longitudinal Transition Study-2 (NLTS2)3 attended two-year colleges at a rate similar to their general education peers, only percent of Students with disabilities attended four-year universities, compared with percent of youth in the general population.
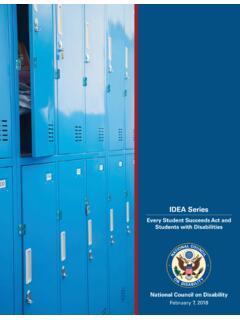
8 The higher rate of attendance at two-year colleges is promising, but the gaps relative to other types of institutions of higher education are sizeable and need attention (Newman, Wagner, Cameto, & Knokey, 2009). Among Students with disabilities who graduate from high school and attend a postsecondary education program, completion rates are low. The majority of Students with disabilities in NLTS2 failed to graduate or to receive a degree from their program up to eight years after high school. Among Students in the 2005 cohort working toward any type of postsecondary credential, only percent graduated or received a degree, versus percent of the general population.
9 Only percent of Students with disabilities working toward a four- year degree were able to graduate within eight years, compared to percent of the general population (Newman et al., 2011). Table 2. Completion of Postseconday Education by Degree Among Special Education Students Out of High School Up to Eight Years, 2009. 70% 60% 50%. 40% 30%. 20%. 10%. 0%. Any Postsecondary 2-Year or 4-Year College Vocational, Business, Community College or University or Technical Young Adults with disabilities Young Adults in General Population Source: Newman, L., Wagner, M., Knokey, , Marder, C., Nagle, K., Shaver, D.
10 , et al. (2011). The post-high school outcomes of young adults with disabilities up to 8 years after high school. A report from the National Longitudinal Transition Study-2 (NLTS2) (NCSER. 2011-3005). Menlo Park, CA: SRI International. Retrieved from 3. The NLTS2 was a 10-year-long study of the characteristics, experiences, and outcomes of a nationally representative sample of youth with disabilities who were 13 to 16 years old and receiving special education services in grade 7 or above, under the Individuals with disabilities Education Act (IDEA) in the 2000 01 school year. The study compared Students with disabilities with those in the general population (Newman et al.)