Transcription of Incarceration Trends in California
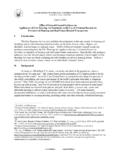
1 Incarceration Trends in California . Incarceration in Local Total REGIONAL RANK. u p i n Cal i f Jails and State Prisons 3. ed ck or ni of 5 in total . lo Incarceration a .. S. ince 1970, the rate of Incarceration in America has expanded more than fourfold, and the 152% United States leads the world in locking people up. Many places in America have begun to reduce their use of prisons and jails, but progress has been uneven. Although the number of people sent to state prisons and county jails from urban areas has decreased, that number has continued to rise in many rural places. Racial disparities in Incarceration remain strikingly 81,095 INCREASE 204,287 wide.
2 Women constitute a rising number of those behind bars. people people This fact sheet provides at-a-glance information about how many people are locked up in both state prisons and county jails and shows where the state stands on a variety of metrics, so that policymakers and the public can better determine where to target reforms. 1983 2015. STATE TOTALS. JAILS PRISONS. % change in jail population % change in prison population Since 1970, the total jail Since 1983, the prison custody SINCE 1970 SINCE 2000 population has increased 180%. SINCE 1983 SINCE 2000 population has increased 225%. In 2015, pretrial detainees In 2018, there were 127,972 people 180% 1% constituted 53% of the total jail 225% -20% in the California prison system.
3 population in California . more on more on more on RACE pg 2 GENDER pg 2 GEOGRAPHY pg 3 . JAILS PRISONS JAILS PRISONS Top admission rates, 2015 (rate per 100K). 2015 2017. 6% 20% 6% 28% 210% 433%. of state of jail of state of prison COUNTY JAILS COUNTY PRISONS. pop. pop. pop. pop. Mendocino 12,628 Tehama 361. Del Norte 12,591 Kings 335. Siskiyou 11,333 Shasta 324. Humboldt 10,796 Lake 308. Plumas 10,755 Yuba 299. In California , Black people constituted 6% Since 1980, the number of women in jail has Incarceration is not only an urban of state residents, but 20% of people in jail increased 210%, and the number of women phenomenon.
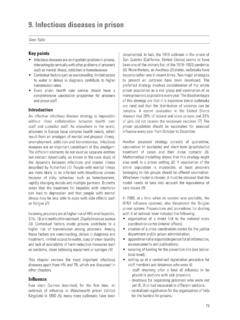
4 In fact, on a per capita basis, and 28% of people in prison . in prison has increased 433%. the most rural places in the state often lock up the most people in jail and send the most people to prison . RACE AND ETHNICITY. 15% 2% 39% 29% 38% 41% 1% 1% 6% 20%. of state of jail of state of jail of state of jail of state of jail of state of jail NATIONAL CONTEXT. JAILS pop. pop. pop. pop. pop. pop. pop. pop. pop. pop. 2015 The overrepresentation of Black Americans in the justice system is well documented. Black men constitute about 13 percent of the male population , but about 35. percent of those incarcerated. One in ve Black people born in Rate per 100,000 ages 15-64 2001 is likely to be incarcerated in Since 1990, the Black Incarceration their lifetime, compared to one in rate has decreased 34 percent.
5 In 10 Latinx people and one in 29. 2015, Black people were white people. incarcerated at times the rate of Discriminatory criminal justice white people, and Native American policies and practices at all stages people were incarcerated at of the justice process have times the rate of white people. unjusti ably disadvantaged Black people, including through disparity in the enforcement of seemingly race-neutral laws. Studies have found that Black 15% 1% 39% 21% 38% 44% 1% 1% 6% 28%. people are more likely to be of state of prison of state of prison of state of prison of state of prison of state of prison stopped by the police, detained PRISONS pop.
6 Pop. pop. pop. pop. pop. pop. pop. pop. pop. pretrial, charged with more serious 2017 crimes, and sentenced more harshly than white people even when controlling for things like offense severity. Nationally, Latinx people are also overrepresented in prisons and Rate per 100,000 ages 15-64 jails, yet common data Since 1978, the Black Incarceration misclassification leads to rate has increased 260 percent. In distorted, lower estimates of Latinx 2017, Black people were Incarceration rates and distorted, incarcerated at times the rate of higher estimates of white white people, and Native American Incarceration rates.
7 Smaller and people were incarcerated at inconsistent data reporting make times the rate of white people. it difficult to measure the effects of racism for incarcerated people of other racial groups. GENDER. JAILS PRISONS NATIONAL CONTEXT. Although men's jail admissions have declined by 26 percent since 2008, women's admissions have increased both as a total number and as a proportion of all jail admissions. Women now make up almost one out of every four jail admissions, up from fewer than one in 10 in 1983. Since 1970, the number of women in jails has increased 14-fold from fewer The number of women in California 's jails The number of women in California 's prisons than 8,000 to nearly 110,000 in has increased more than vefold, from 1,725 has increased more than sixfold, from 847 in 2013 and women in jail now in 1970 to 9,443 in 2015.
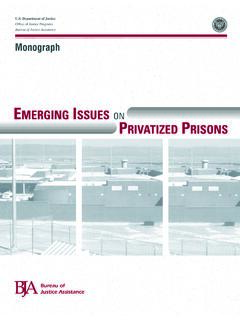
8 1978 to 5,793 in 2017. account for approximately half of all women behind bars in the country. GEOGRAPHY. Statewide Trends alone do not tell the whole story of % change in jail population Incarceration : there is wide variation in the use of from 2005 to 2015. Incarceration across the state. Today, the highest rates of prison admissions are in rural counties, and pretrial st decre detention continues to increase in smaller counties even as ate as re G. e it is on the decline in larger counties. It is critical to examine Incarceration Trends in every corner of the state, 77%. because although the largest counties may have the most Sierra people in jails the highest rates of Incarceration are in st incre County ate as re smaller cities and rural counties.
9 G. e 75%. Kings County 17% to 75%. 5% to 17%. 0% to 5%. -16% to 0%. -77% to -16%. Comparing the jail populations for 2005. and 2015, counties shaded dark gray had fewer people in jail and those JAILS Pretrial population shaded dark red had more people in jail. Since 2000, the state's use of pretrial detention has taken different trajectories in different types of counties. The pretrial Incarceration rate has increased 12% in the state's 21 rural counties. It has decreased 6% in the state's 21. small/medium counties, 31% in the state's eight suburban counties, and 28% in the state's eight urban counties. Vera's analysis of the urban-rural continuum changes the six categories de ned by the National Center for Health Statistics Urban- Rural Classi cation Scheme for Counties to four.
10 A county is labeled urban if it is one of the core counties of a metropolitan area with 1. million or more people and is labeled suburban if it is within the surrounding metropolitan area. Vera turns the remaining four categories into two by combining small and medium metropolitan areas ( small and midsize metro ) and micropolitan and noncore areas ( rural ). (TOP 10 OF 58 COUNTIES) (TOP 10 OF 58 COUNTIES). JAIL ADMISSIONS prison ADMISSIONS. 2015 2015. Rate Annual Rate Annual COUNTY (per 100K) COUNTY count COUNTY (per 100K) COUNTY count HOW DOES California COMPARE? JAILS PRISONS. Jail admissions prison admissions Rate Rate Rate change Rate change Rank State (2015) ('05 '15) Rank State (2016) ('06 '16).