Transcription of Incident vs. Prevalent Cases and Measures of Occurrence
1 ERIC at the UNC CH Department of Epidemiology Medical Center Incident vs. Prevalent Cases and Measures of Occurrence E R I C N O T E B O O K S E R I E S To determine which factors impact health outcomes at the population level, epidemiologists employ a number of different study designs. These designs are used to examine the relationship between exposures (or determinants) and health outcomes. A health outcome may be a disease, condition, death, event or a change in health status or behavior. For example, in addition to diseases, we may study health events such as injuries or the Occurrence of an event such as preterm birth. Persons who experience the outcome of interest are commonly referred to as Cases . One of the first things to consider when developing a study is whether you will measure Prevalent or Incident Cases . Prevalent Cases are all individuals living with the outcome of interest within a specified timeframe, regardless of when that person was diagnosed or developed the health outcome .
2 Incident Cases are all individuals who change in status from non-disease to disease or from one state of a health outcome to another over a specific period of time. In other words, incidence refers to the Occurrence of new Cases . Measures of frequency Prevalence Prevalence is the proportion of a population living with a specific health outcome within a specified time. It is the only measure of Occurrence calculated with Prevalent Cases . To calculate prevalence, the number of Prevalent Cases (numerator) is divided by the total population at risk Second Edition Authors: Lorraine K. Alexander, DrPH Brettania Lopes, MPH Kristen Ricchetti-Masterson, MSPH Karin B. Yeatts, PhD, MS Second Edition Example In a study of Prevalent Cases of diabetes with a one year time period, anyone who has diabetes during the one year study period would be counted as a case. These Prevalent Cases would include both people who have diabetes at the outset of the study year as well as any who developed diabetes over the course of the study.
3 Example For example, in a study of Incident Cases of diabetes with a one year time period, only those who developed diabetes over the course of the one year study period are considered Incident Cases . ERIC at the UNC CH Department of Epidemiology Medical Center (denominator.) The total population at risk denominator includes the Prevalent Cases . Prevalence is often reported as a percentage. Prevalence = Prevalent Cases / Total population Depending on the type of prevalence being calculated, the denominator can be either an average of the population over time or a single measurement at a specific point of time. Prevalence can either be calculated as a point prevalence or period prevalence. A point prevalence is calculated with data from one specific point in time, while a period prevalence is calculated over a range of time. Prevalence is directly affected by the incidence and duration of the health outcome under study, which makes it a poor choice for diseases or outcomes with a short duration or high mortality rate.
4 Prevalence = Rate x Duration Risk Like prevalence, risk is also a measure of the extent of a health outcome in a population. However, unlike prevalence, risk is the proportion of an at-risk population that develops a specific health outcome within a specified amount of time. The numerator for risk is Incident Cases , and the denominator includes only those at-risk of developing the outcome of interest at the beginning of study follow-up. Risk = Incident Cases / Population at-risk Risks are often reported as a scaled value, such as Cases per 1,000; 10,000; or 100,000 population. Rate Rate is another measure of health outcome Occurrence calculated with Incident Cases of the health outcome . However, the denominator for a rate is the total amount of person-time at-risk. Person-time is an estimate of the actual time-at-risk in years, months, or days that all participants contributed to a study.
5 In its simplest form, person-time is a sum of each study participant s time at risk before experiencing the outcome of interest or exiting the study. This is a better estimate of the true at-risk population because it excludes time for participants who are no longer eligible to experience the outcome of interest. Thus, rates are a better reflection of health outcome Occurrence in a dynamic population, where participants may exit the study or become no longer at-risk. Rate = Incident Cases / Total person-time at-risk The unit for a rate is Cases per person-time. Rates are often reported as a scaled value with a time unit relevant for the study, such as Cases per 1,000 person-years, 12,000 person-months, or 365,000 person-days. Rates are favored if the rapidity with which new Cases of the health outcome or new events are occurring in the population is of interest.
6 E R I C N O T E B O O K PA G E 2 Example For example, Vibrio vulnificus a disease caused by consumption of raw shellfish has a low incidence and short duration. Therefore, the few new ( Incident ) Cases that arise will remain Prevalent in the population for only a short time before the Cases recover or die. However, for a disease like diabetes, which has a higher risk or rate and longer duration, the prevalence will be higher than the risk or rate and is a valuable measure of the burden of disease in the population. Example If the disease under study is ovarian cancer, which obviously only affects women, the denominator should consist only of women in the population who, at the start of study observation, do not have ovarian cancer and are capable of developing ovarian cancer. ERIC at the UNC CH Department of Epidemiology Medical Center 2) Now researchers want to study the risk of head injuries that occur while a person was riding a bicycle, in the United States between 2000-2013.
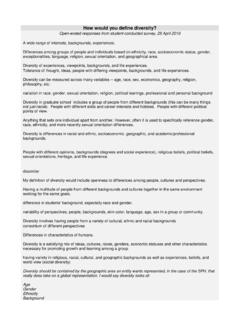
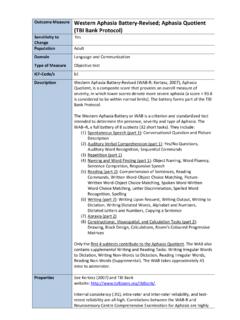
7 How would the risk denominator ideally be calculated? Choose the one best answer. a) All people living in the United States in the time period 2000-2013 b) All people who rode a bicycle in the United States in the time period 2000-2013 c) All people who owned or had access to a bicycle in the United States in the time period 2000-2013 d) The actual number of documented head injuries due to bicycle accidents in the United States in the time period 2000-2013 e) All people who had a head injury in the United States in the time period 2000-2013 References Dr. Carl M. Shy, Epidemiology 160/600 Introduction to Epidemiology for Public Health course lectures, 1994-2001, The University of North Carolina at Chapel Hill, Department of Epidemiology Comparing Measures of Occurrence The image of the bathtub below graphically represents the relationships between prevalence, risk, and rate.
8 In this analogy, prevalence is the proportion of the tub (the total population) filled with any water ( Prevalent Cases and Incident Cases ). Risk is the proportion of the tub filled with new, flowing water ( Incident Cases ). Rate is a measure of how quickly the water flows into the tub. Prevalent Cases only leave the prevalence pool by either recovery, death, migration out of the population or loss of study follow-up via the bathtub drain. Practice Questions Answers are located at the end of this notebook. 1) If researchers were studying the risk of a woman having a baby born preterm in the United States in 2013, what would the at-risk population be? Assume for this question that a pre-term birth is any birth before 39 weeks gestation. Choose the one best answer. a) All women in the United States in 2013 b) All pregnant women in the United States in 2013 c) The actual number of babies born preterm in the United States in 2013 d) All babies born in the United States in 2013 e) All pregnant women in the United States whose due dates would mean that the baby could potentially be born pre-term in the year 2013 E R I C N O T E B O O K PA G E 3 Terminology Prevalent Cases all individuals living with the health outcome of interest within a specified timeframe, regardless of when that person was diagnosed or developed the health outcome Incident Cases all individuals who change in status from one state of health to another (such as non-disease to disease)
9 Over a specific period of time Prevalence the proportion of a population living with a specific health outcome within a specified timeframe Risk the proportion of an at-risk population that develops a specific health outcome within a specified amount of time Rate the frequency of Incident Cases per unit of person-time ERIC at the UNC CH Department of Epidemiology Medical Center 2013. Answer choice c (The actual number of babies born preterm in the United States in 2013) is incorrect because this is not the at-risk population needed for a risk measure since this is a count of babies already born preterm. Similarly, answer choice d (All babies born in the United States in 2013) is incorrect because it does not represent the at-risk population that would need to be followed over time. 2. The best answer was b: All people who rode a bicycle in the United States in 2013.
10 In your risk denominator, you want to only include people actually at-risk of the outcome . In order to have a head injury that arises from riding a bicycle, a person would actually have to be riding a bicycle, otherwise they would never be at-risk for the outcome under study. Answer a (All people living in the United States in the time period 2000-2013) is not the best choice because all of these people did not ride a bicycle. Answer c (All people who owned or had access to a bicycle in the United States in the time period 2000-2013) is incorrect for the same reason. Just because someone has access to a bicycle does not mean they actually rode one. Answer d (The actual number of documented head injuries due to bicycle accidents in the United States in the time period 2000-2013) is not correct because the researchers are studying Incident Cases among all people at risk for the outcome .