Transcription of Inclusion: Key Trends and Developments - CGAP
1 BRIEF International funding for Financial inclusion : Key Trends and Developments The 2017 edition of CGAP's annual Cross-Border Funder Survey reports funding commitments from the 23 largest international funders of financial inclusion , representing 80 percent of the full set of over 54 international funders and 73 percent of the global estimated funding commitments for financial inclusion in Financial inclusion , which is broadly perceived as an enabler of Sustainable development Goals (SDGs), remains an important focus for funders. Survey results indicate that funding commitments continue to grow steadily, especially in Sub-Saharan Africa (SSA). International funders are increasingly targeting capacity building for financial services providers (FSPs) and financial inclusion policy and regulation, and at this point, every funder supports the development of digital financial services (DFS). funding for financial inclusion and development (OECD). According to OECD, cross- border aid across all development sectors reached a new continues to grow steadily peak in 2016, growing by percent (OECD 2017a).
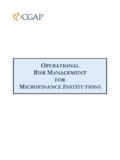
2 For the third year in a row In 2016, public funders covered by the CGAP Funder Survey approved 499 new projects twice the number International funding for financial inclusion reached a of terminated projects, which resulted in a US$ billion historic high of US$37 billion in 2016, marking a 9 percent increase in public funding growth rate from the previous year. While, in terms of volume, growth stems from public and private funding However, the 16 percent growth of private funding alike,2 the latter is growing at a faster pace (more than in 2016 comes as a surprise (Symbiotics 2017). The 16 percent from US$ billion to US$11 billion) than year before, the Symbiotics Microfinance Investment public funding (more than 6 percent from US$ billion Vehicles (MIV) Survey projected that 2016 would mark to US$26 billion). the slowest growth for MIVs (making up the majority of private funding ) in the past decade (Symbiotics While not directly comparable, this trend is in line with 2017).
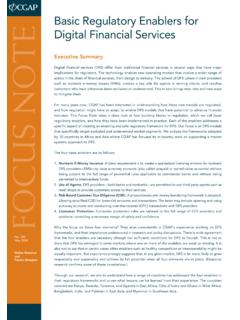
3 However, the actual results suggest that (i) MIV. the general official development assistance Trends assets have grown by 10 percent and (ii) growth is reported by the Organisation for Economic Co-operation likely to continue in 2017 and at a more rapid Figure 1. Global funding Trends for financial inclusion (2011 2016). 40B. 37B. funding Type 35B Private 34B. Public 31B 30B 29%. 30B 29B. 28%. 26B 27% 28%. 25B 29%. Commitments 32%. 20B. 15B. 71%. 72%. 73% 72%. 10B 71%. 68%. 5B. 0B. 2011 2012 2013 2014 2015 2016. Source: 2012 2017 CGAP Funder Survey, N523 funders. 1 CGAP surveys the full set of more than 54 funders biannually. In 2016, the CGAP Funder Survey was implemented for the full set of international funders. In 2017, a sample consisting of the top 23 funders was surveyed. CGAP has conducted the survey since 2008, and since 2012, in partnership with MIX. 2 Public funding includes commitments of development finance institutions and bilateral and multilateral development /aid agencies.
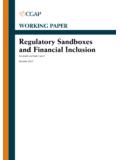
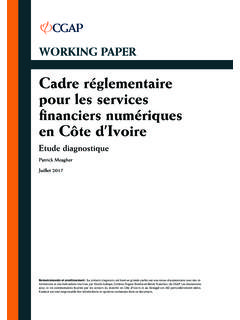
4 Private funding includes commitments from foundations, private donors and investors, and microfinance investment vehicles' assets originating from high net worth individuals and other institutional investors. 3 The global estimate is the sum of international funders' commitments to financial inclusion and the microfinance investment vehicles' (MIV). assets. The funding MIVs receive from international funders was excluded to avoid double counting. For more information, refer to the survey methodology at December 2017. 4 Until 2016, forecasted growth rates included those MIVs that were expected to cease operations in each year. Hence, the forecasted growth was generally understated. For 2017, the forecast is adjusted to consider only those MIVs that are expected to remain active. 2. Figure 2. funding commitments by purpose, 2016. Loan Portfolio funding Unspecified 75% 11%. Capacity building - Policy Providers and re- 7% gulation 3%. Infrastructure 2% Capacity Building - Clients 2%.
5 Source: 2017 CGAP Funder Survey, N523 funders. The trend is further confirmed by the results of the funding channeled to FSPs increased considerably in Global Impact Investing Network survey (2017), which 2016, especially in the Middle East and North Africa shows that the greatest share of impact capital was (MENA). funding to central banks and government had allocated to microfinance and other financial services, declined in the past two years, while funding to MIVs followed by energy and housing. This is especially slightly increased after two years in recession. true for emerging-market-focused investors who allocated a higher share of capital to microfinance and Strategy adaptation is still the other financial services (40 percent and 17 percent, major challenge for funders . respectively) in 2017 (GIIN 2017). financial inclusion is seen as an enabler within the SDGs, and Funders target a broader not as a standalone objective range of actors in the financial inclusion space through the For the third consecutive year, international funders traditional mix of instruments identified strategy adaptation as their key challenge, due to the rise of other priorities and macro-level As new actors are entering the quickly evolving financial factors beyond funders' control ( , natural disasters inclusion sector, a broader array of recipients is being and conflicts).
6 However, this priority shift does not funded. While funding of loan portfolios continued to seem to have affected funding decisions for financial represent three quarters of the overall funding volume in inclusion yet: the share of financial inclusion is the same 2016, it is no longer exclusive to FSPs and intermediaries: or higher within funders' total development portfolio mobile money operators and other digital services (about 25 percent). In 2016, funding flows for financial providers are now also a focus for financial and technical inclusion grew one-third of commitments were made assistance at the retail level. At least one-third of the as part of broader financial-sector development projects projects target capacity building across the various levels (20 percent) and other development projects ( , of the financial sector and half have a capacity building water and sanitation, environmental protection, energy component for FSPs. Despite relatively small funding efficiency, etc.)
7 (11 percent). amounts, improving the financial ecosystem to enable financial inclusion is an important focus for funders. Apart from supporting micro and small enterprises Capacity building of providers represents 7 percent (1,240 projects), funders placed significant focus on of the overall funding volume. In addition, payments improving access to finance for rural and agricultural infrastructure has grown to be an important focus for finance (647 projects), women's economic empowerment funders and represents one-third of overall funding (223 projects) (Box 1), and digital finance (181 projects). for financial sector infrastructure (2 percent of overall (Box 2). While these figures indicate relative focus, funding ). Capacity building for end clients (individuals, many projects are holistic in scope and target multiple households, and enterprises), policy, and regulation for themes simultaneously, making it difficult to break down financial inclusion collectively account for 5 percent of funding to any given theme based on the funder survey overall funding .
8 Dataset. Following a decline in 2015, debt funding (over SSA ranks second in terms of 50 percent of overall commitments) increased by funding volume and first in 5 percent in 2016. Almost half of overall debt went terms of number of projects to Europe and Central Asia (ECA), while the rest was relatively evenly distributed across the other regions. The funding for SSA grew by 30 percent in 2016, reaching Both grants and equity, which accounted for 21 percent US$ billion in commitments through 611 active and 7 percent of total funding respectively, increased by projects. While funders have been increasing their active 18 percent and 5 percent, respectively, in 2016. projects steadily in the region for the past five years, 3. Box 1. funding for women's access to finance Women's economic empowerment has been an important focus for financial inclusion efforts one in every 10 projects was tagged with this theme in 2016. The 23 funders that reported to the 2016 CGAP Funder Survey identified 223 projects aimed at empowering women's access to financial services; 86 percent of these projects were funded by public funders (DFIs, 100 projects, and multilateral agencies, 93 projects).
9 Almost half of these projects target low- or lower-middle-income countries. Twenty-six percent of these projects are in SSA. In terms of implementation, 30 percent of these projects are channeled via governments as part of their comprehensive programs aimed at enhancing women's access to financial services, among other objectives. Another 30 percent are channeled via FSPs to improve the range and quality of financial products and services for women. the growth of commitments was much higher in 2016. The top five countries receiving the most financial This also indicates a growth in the average project size inclusion funding in 2016 are Turkey, India, Egypt, (from US$5 million to US$6 million). While public funders Cambodia, and Indonesia. Together, they account for continue to drive the growth in SSA, foundations have 25 percent of all single country funding . Except for grown the fastest over the past three years in terms of Cambodia, the average project sizes in these countries the number of projects, resulting in 25 percent of all are several times higher than the global average.
10 Thus, projects committed to by foundations in 2016. only 10 percent of all active projects are in these five countries. The countries with the highest number of On the other hand, in ECA, which traditionally has been projects are India (119), Cambodia (74), Kenya (52), the top-funded region, funding has been declining for Nigeria (49), and Honduras (43). the second year in a row, with most of the commitments coming from development finance institutions (DFIs) and Looking at the geographic allocation of financial multilaterals and very few from other types of funders. inclusion funding by country income classification, lower The average commitment in ECA per project in 2016 middle-income countries are the greatest beneficiaries was $12 million double the average project size in SSA, in terms of active projects and commitments ($6 billion). which explains why ECA is the leading region in terms of However, funding to low-income countries has grown funding volume but only second in terms of the number the quickest by 13 percent annually since 2014.