Transcription of Independently peer reviewed paper - Glass Properties
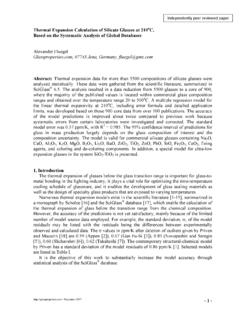
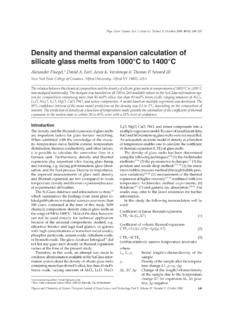
1 - December 2007 - 1 Electrical resistivity of Silicate Glass Melts Calculation Based on the SciGlass Database Alexander Fluegel*, David A. Earl, Arun K. Varshneya New York State College of Ceramics; Alfred University; Alfred NY 14802; USA *now with: ; 07743 Jena; Germany Abstract The relation between the chemical composition and the electrical resistivity (= 1/conductivity) of silicate Glass melts at temperatures of 1000oC to 1400oC from the SciGlass Database was analyzed statistically. A model including ionic interactions was developed that permits calculating the Glass melt electrical resistivity with a standard error of about on the logarithmic resistivity scale in cm. The 95% confidence interval of the model prediction for industrial glasses in mass production largely depends on the composition of interest and the composition uncertainty, which can be quantified through software derived from this work.
2 Introduction The electrical resistivity of Glass melts is important for designing and operating electrical Glass melting furnaces [1, 2]. It is the intention of this work to develop highly accurate predictions of electrical resistivity based on all available composition- resistivity data in the scientific literature. Despite its high importance, few attempts have been made to calculate the electrical resistivity of Glass melts based on their chemical composition. Often scientists and engineers refer to similar (and sometimes contradicting) data in the published literature or rely on time consuming and expensive experimental investigations. Only three advanced resistivity calculation methods exist to the authors knowledge: the models by Mazurin and Prokhorenko [2], applicable to soda-lime and sodium borosilicate Glass melts; the models by Hrma et al.
3 And Vienna et al. [3, 4], applicable to special borosilicate Glass melts used for nuclear waste vitrification; and the models by Fluegel et al. [5], applicable to various commercial soda-lime, borosilicate, and TV panel Glass melts. The drawback of all the mentioned models is that they are based on experimental data from only one laboratory, which makes systematic errors possible [5]. Systematic comparisons to findings from other laboratories were not performed. The paper by Fluegel et al. [5] also contains simple models for the binary and ternary systems SiO2-Na2O, SiO2-K2O, and SiO2-Na2O-CaO. Those simple models have no direct industrial application, but they use a high number of experimental values obtained for the mentioned systems from the scientific literature. This makes them accurate and valuable for "model calibration.
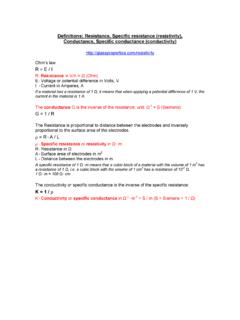
4 " No standard reference material for the electrical resistivity of Glass melts has been established that could be used for calibration otherwise. The simple models by Fluegel et al. [5] are summarized in the Tables I to III and in Appendix (B). Various Glass melt electrical resistivity measurement techniques are not always comparable. In the following paragraphs, measurement techniques are briefly reviewed . The electrical resistivity is defined as = R A / L Eq. (1) Independently peer reviewed paper - December 2007 - 2 where A is the surface area of flat parallel electrodes, L is the distance between the electrodes, and R is the resistance. The unit of the resistivity or specific resistance is m (or cm in this paper ). The conductivity or specific conductance is the reciprocal of the resistivity , = 1/ , with the unit ( m)-1 or S/m (S = Siemens).
5 In Glass melts, the electric current is predominantly transported through mobile ions. Other conducting species are not considered in this work. All measurements discussed in this paper were performed using alternating current (AC). For accurate measurements of the electrical resistivity of Glass melts, several details have to be considered. At the beginning of measurements, relatively low potential barriers occur for some conducting ions because of a broad potential barrier distribution caused by polarization effects in the electric field (ionic polarization). The conducting ions are capable of surmounting the low barriers easily, and the measured resistivity is relatively low. Eventually, as higher potential barriers appear for all conducting ions, the resistivity increases, and the constant steady-state resistivity is reached [2].
6 The conducting ions in the Glass melt are discharged at the electrode surfaces, and insulating layers are formed, causing electrode polarization. The electrode polarization increases with decreasing AC frequency, , the melt resistivity appears to increase as well with decreasing AC frequency up to about 2 kHz. For obtaining resistivity data with reduced or negligible influence of electrode polarization effects, it is beneficial to record the electrical resistivity over various frequencies and to extrapolate to a constant resistivity value in the frequency-independent region at high frequency. However, the electrode polarization can never be totally avoided at Glass -melting temperatures because ions are the predominantly conducting species in the Glass melt, and electrons are the conducting species in the electrodes, , surface reactions must always take place.
7 Therefore, the electrode material influences the electrode polarization [6]. For Glass melts, platinum electrodes are used most frequently in research at various frequencies, while less expensive molybdenum or tin oxide electrodes are used for industrial applications, often at 50 to 60 Hz. The polarization-free resistivity of Glass can be derived from the impedance-frequency spectrum by assuming equivalent circuits as described, for example, by Ravagnani et al. [7], Keding et al. [8], and Schiefelbein et al. [9]. Because the shape of the electric field during electrical resistivity measurements influences the result [9], a well-defined cell construction [10] is superior in principle to platinum-wire electrode techniques [2, 11-17]. The applied potential gradient during resistivity measurements of Glass melts is not reported in several papers, unfortunately, despite its influence on the resistivity at high voltages because of various ionization potentials of the conducting ions [18-20].
8 Schiefelbein et al. [9] was using 30 to 60 mV. Statistical data analysis 1) Source data handling All experimental values in this work were obtained from original publications [2, 3, 11, 14-17, 21-24] and the SciGlass Database [25]. Data from several references are listed in Appendix (A) for convenience. The chemical Glass compositions were converted to mol%. Among the equations used for describing the temperature dependence of the electrical resistivity of Glass - December 2007 - 3 melts [1, p 31], the Vogel-Fulcher-Tammann equation (VFT) was found to be accurate over the temperature range studied: log10( / cm) = A + B / (T To) Eq. (2) where T is the temperature and A, B, and To are composition-dependent parameters. However, these parameters are sensitive; their values can significantly change in response to small modifications of the data fitted.
9 The parameters of the VFT equation only become relatively stable if experimental data in a temperature interval of several hundred oC are available, which is seldom the case, and even then, the measurement requires various techniques associated with additional errors (see ref. [5] for a discussion regarding Glass viscosity). To obtain maximum model accuracy with the available data, predictive models for the electrical resistivity of silicate Glass melts were developed for three reference temperatures: 1000oC, 1200oC, and 1400oC. Experimental resistivity data were interpolated, using Equation (2), to obtain log10( / cm) at the three reference temperatures. The logarithmic scale is necessary for obtaining a constant error variance [26], , for converting the relative error of resistivity measurements to an absolute error.
10 Because of the lack of an electrical resistivity standard Glass , mean orientation values were established based on previously developed models for the systems SiO2-Na2O, SiO2-K2O, and SiO2-CaO-Na2O [5]. The model source data and procedures are summarized in Appendix (B), and the mean orientation values (resistivities at reference temperatures) are listed in Tables I to III. The mean orientation values are based on a total of 400 experimental data from 47 references. The mean orientation values, available in the systems SiO2-Na2O and SiO2-CaO-Na2O for all reference temperatures, and in SiO2-K2O for 1400oC [5] were incorporated into the models in the same way as data-series by specific investigators, , they were treated as experimental data. Based on initial model development, the limited data for multi-component glasses containing appreciable amounts of K2O appeared inconsistent with the mean orientation values in the system SiO2-K2O at 1000oC and 1200oC that were previously established as reliable.