Transcription of Index Carbon Metrics Explained - S&P Global
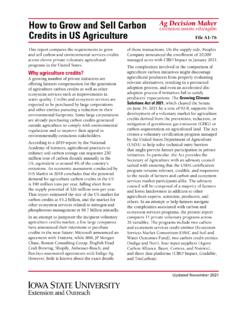
1 Index Carbon Metrics Explained As part of its commitment to supporting ESG transparency, S&P Dow Jones Indices provides Carbon exposure Metrics for its Global indices to help market participants understand, measure, and manage Carbon risk. Four Carbon exposure Metrics are provided, where data are available. Exhibit 1: Carbon Exposure Metrics Source: S&P Dow Jones Indices LLC, Trucost. Chart is for illustrative purposes. S&P Dow Jones Indices calculates these Metrics using Trucost data and analysis to determine the Carbon exposure of the companies in its indices.
2 The Trucost analysis covers 15,000 companies, representing 95% of Global market capitalization. In the absence of company disclosure, estimations are provided using Trucost s granular, multi-sector assessment of company business activities and proprietary environmentally extended input-output model. The result is a complete environmental performance profile, encompassing company operations and supply chain tiers back to raw materials extraction. Carbon EXPOSURE METRIC DEFINITIONS Carbon Footprint This approach normalizes the Index s absolute owned greenhouse gas emissions by the total value invested in the Index .
3 This metric is a Carbon responsibility metric in that it describes the associated greenhouse gas impact per USD 1 million invested in the Index , allowing for comparisons across investments of different sizes, time periods, and indices. It is calculated by dividing the sum of all owned constituent greenhouse gas emissions by the total value invested in the Index in millions of dollars. Carbon Footprint Metric tons CO2e /USD 1 million invested The aggregation of operational and first-tier supply chain Carbon footprints of Index constituents per USD 1 million invested.
4 Carbon Efficiency Metric tons CO2e /USD 1 million revenues The aggregation of operational and first-tier supply chain Carbon footprints of Index constituents per USD 1 million in revenue. Weighted Average Carbon Intensity Metric tons CO2 /USD 1 million revenues The weighted average of individual company intensities (operational and first-tier supply chain emissions over revenues), weighted by the proportion of each constituent in the Index . Fossil Fuel Reserves Metric tons CO2 /USD 1 million invested The Carbon footprint that could be generated if the proven and probable fossil fuel reserves owned by Index constituents were burned per USD 1 million invested.
5 Index Carbon Metrics Explained 2 Equation 1: Carbon Intensity per USD 1 Million Invested ( ) , , ( , / , , ) Where: (tCO2e) i,t,y is the owned constituent greenhouse gas emissions (tCO2e) for constituent i, as of the effective date t, for the financial year data used in the analysis y; Invi,t is the total value invested (USD) in constituent i, as of the effective date t; and n is the number of companies in the Index . Equation : Owned Constituent Greenhouse Gas Emissions (tCO2e) , , =( ) , , =( , , 1,000,000) 2 , Where: (tCO2e) i,t,y is the owned constituent greenhouse gas emissions: the metric tons of Carbon dioxide-equivalent operational and first-tier supply chain greenhouse gas emissions (tCO2e) associated with the ownership or financing of Index constituent i as of the effective date t (see Equation ).
6 Carbon data used for each constituent is for the latest financial year analyzed by Trucost y as of the effective date; tCO2ei,y is the constituent greenhouse gas emissions: the Carbon dioxide-equivalent operational and first-tier supply chain greenhouse gas emissions (tCO2e) of constituent i for the financial year data used in the analysis y; and EVi,t is the constituent enterprise value (USD millions): the enterprise value for constituent i as of the effective date t. Where a constituent s enterprise value is unavailable, market capitalization (USD millions) as of the effective date is used instead.
7 Carbon Efficiency This footprint metric normalizes the Index s absolute owned greenhouse gas emissions by the quantity of constituent revenues apportioned to an investment in the Index in terms of USD millions. This approach indicates a level of Carbon risk associated with an Index by quantifying the relationship between constituent revenue earnings and greenhouse gas emissions. It is calculated by dividing the sum of all owned constituent greenhouse gas emissions by the sum of all apportioned revenues (see Equation 2) in millions of dollars. Index Carbon Metrics Explained 3 Equation 2: Carbon Intensity per USD 1 Million of Revenue Generated ( ) , , ( ) , , Where: (tCO2e) i,t,y is the owned constituent greenhouse gas emissions (tCO2e) for constituent i as of the effective date t for the financial year data used in the analysis y; (Rev) i,t,y is the apportioned revenues (USD millions) of constituent i as of the effective date t for the financial year data used in the analysis y (see Equation ); and n is the number of companies in the Index .
8 Equation : Apportioned Revenues , , = ( ) , , =( , , 1,000,000) , Where: (Rev) i,t,y is the apportioned revenues: the constituent annual revenues (USD millions) associated with the ownership, or financing, of Index constituent i as of the effective date t using the constituent s revenues data for the financial year used in the analysis y. This financial year is common to both revenues and emissions data per constituent; and Revi,t,y is the constituent revenues: the constituent annual revenues (USD millions) of Index constituent i as of the effective date t using the constituent s revenues data for the financial year used in the analysis y.
9 Weighted Average Carbon Intensity The Weighted Average Carbon Intensity metric estimates the Index s exposure to Carbon -intensive companies. For this calculation, the Carbon intensity of each constituent in the Index (tCO2e/USD 1 million) is taken and multiplied by its weight in the Index . The final Carbon intensity for the Index is the sum of these contributions. Unlike the above two Metrics , the greenhouse gas emission intensities are allocated based on Index weights, rather than on an ownership or responsibility basis. Equation 3: Weighted average Carbon intensity (emissions per USD 1 million of revenue generated) , ( , , ) Where: wi,t is the weight of constituent i within the Index at time t; tCO2ei,y is the constituent greenhouse gas emissions: the Carbon dioxide-equivalent operational and first-tier supply chain greenhouse gas emissions (tCO2e) of constituent i for the financial year data used in the analysis y.
10 And Index Carbon Metrics Explained 4 Revi,y is the constituent revenues: the constituent annual revenues (USD millions) of Index constituent i for the financial year used in the analysis y. Fossil Fuel Reserves This metric describes the quantities of greenhouse gas emissions that could be generated if the proven (1P) and probable (2P) fossil fuel reserves owned by Index constituents were realized and burned. This metric indicates relative levels of stranded asset risk across different indices and is expressed on a basis of per USD 1 million invested in the Index , allowing for comparisons across investments of different sizes, time periods, and indices.