Transcription of INDICATORS OF HEALTH
1 HEALTH INDICATORS are useful tools for monitoring the HEALTH of the population and commu-nicating with multiple audiences about opportunities to improve HEALTH . These INDICATORS are designed to reflect the broad contributors to HEALTH social and physical environments,behaviors, and HEALTH conditions. Most importantly, they invite action by an increasinglybroad range of individuals and organizations who share some responsibility for HEALTH , evenif their primary mission falls outside the traditional domain of HEALTH care or public HEALTH . The conditions represented by these INDICATORS point to real opportunities for has shown the high rate of return on public HEALTH investments.
2 In fact, invest-ments in prevention during the past century are estimated to account for 25 of the 30 yearsgained in average life expectancy in the For example, vaccines to protect children frompolio and other infectious diseases, improvements in motor vehicle safety, safer and healthierfoods, and clean drinking water, have saved lives and prevented disability. Furthermore, thecosts associated with preventable disease and disability are high. For example, in Los AngelesCounty, the direct medical and indirect costs of obesity are estimated at $ billion, andsmoking at $ billion, annually. Wise investments in policy and program-based strategies can yield enormous payoffswhether implemented in schools, worksites, HEALTH care facilities, or in community interventions can be especially cost-effective ways to prevent disease and include implementing nutritional standards on school campuses, taxes on alcohol,and protocols to enhance workplace safety.
3 In HEALTH care settings, smoking cessation counsel-ing by physicians and age-appropriate cancer screening are examples of cost-effective ways toprevent disease and improve HEALTH outcomes. Community-based interventions may includeimproving physical activity curricula in schools, upgrading parks and recreation facilities, andproviding safe after-school activities for youth. Proven effective approaches to improvinghealth exist, and we must utilize them to get the highest return on our collective hope that the information in this report provides a rich snapshot of HEALTH in LosAngeles County. Please note that statistical comparisons to the average should not alwayssuggest that the average is desirable or acceptable.
4 For example, the fact that smoking rateshave declined to their lowest level in over two decades of monitoring is good news; however,none would argue that a smoking rate above zero yields the best possible HEALTH encourage your feedback and partnership in attaining better HEALTH for all. Jonathan E. Fielding, MD, MPHD irector of Public HEALTH and HEALTH OfficerA PUBLICATION OF LOS ANGELES COUNTY DEPARTMENT OF HEALTH SERVICES PUBLIC HEALTHKEYINDICATORSOF HEALTHBY SERVICE PLANNING AREA POPULATION RANKINGP opulations of County SPAs and individual states by York (9,519,338)10.
5 New Jersey 11. Georgia Carolina 13. Virginia 15. Indiana 16. Washington 17. Tennessee 20. Maryland 22. Minnesota 23. Louisiana 25. Colorado 26. Kentucky Carolina 29. Oregon 30. Connecticut 31. Iowa 32. Mississippi 33. Kansas 34. Arkansas 36. Nevada 2 San Fernando (1,981,961)38. New Mexico Virginia 3 San Gabriel (1,734,254)41. Nebraska 8 South Bay (1,500,185)43. Idaho 7 East (1,285,210)45. Maine 46. New Hampshire 47. Hawaii 4 Metro (1,144,083) Island 6 South (955,054) 52. Delaware 53. South Dakota Dakota 55. Alaska 5 West (613,191) of Columbia 59.
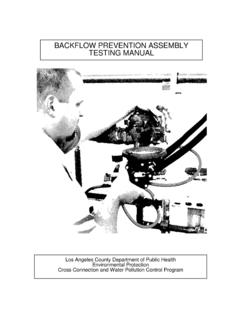
6 1 Antelope Valley (305,400)This publication, Key INDICATORS of HEALTH ,provides data for over 60 HEALTH indicatorsfor County and each of the county seight Service Planning Areas (or SPAs).These areas form the organizational basisfor many efforts to improve HEALTH . Assuch, it is vital that we track HEALTH indica-tors at the SPA level over time. As depict-ed in the population ranking (at right),many of County s SPAs are comparablewith several states in total any of the Public HEALTH programs orcontact any of the eight SPA Offices Long BeachRolling HillsTorranceCarsonHawthorneRedondo BeachCerritosMontebelloWhittierDowneyNor walkVernonLos AngelesLynwoodComptonLos AngelesSanta MonicaMalibuBeverly HillsLos AngelesWest HollywoodAzusaPasadenaAlhambraArcadiaEl MonteDiamond BarPomonaSan DimasSan FernandoSanta ClaritaVal VerdeGlendaleBurbankLos AngelesCalabasasLancasterPalmdaleQuartz HillLittlerockLake Los AngelesSERVICE PLANNING AREAS (SPAs)
7 BOUNDARIESSPA 1 Antelope ValleySPA 2 San FernandoSPA 3 San GabrielSPA 4 MetroSPA 5 WestSPA 6 SouthSPA 7 EastSPA 8 South CountyHealthy People 2010includes Catalina IslandA USER S GUIDE TO COLOREach SPA is designated by a specific color, asseen below and at right, that is continuedthroughout this for County is highlighted along withnotations that show whether a particular SPA isfaring better or worse than the County average, based on statistical addition, the Healthy People 201021objec-tives are provided where available and comparableto the indicator . Approximately 40% of all deaths in theUnited States are linked to smoking, physicalinactivity, poor nutrition, alcohol abuse, andother drug community-basedand HEALTH care provider interventions havebeen proven to reduce these and otherhealth risk behaviors.
8 And to increasehealth-promoting BEHAVIORSA ntelope ValleySan FernandoSan GabrielMetroWestSouthEastSouth BaySPA 1 SPA 2 SPA 3 SPA 4 SPA 5 SPA 6 SPA 7 SPA 8 Healthy People 2010 Los Angeles County Key INDICATORS of HEALTH by Service Planning Area 2002/2003 Alcohol and Drug Use Rate of drug-related death among adults (age-adjusted per 100,000 population) Percent of all adults who binge drink had 5 or more alcoholic drinks (4 for women) on at least one occasion in the past 30 Percent of teens ages 14 17 who drink consumed at least one alcoholic drink in the past 30 days3 (Los Angeles Unified School District only) Use Percent of adults who smoke Percent of teens ages 14 17 years who smoke cigarettes3 (Los Angeles Unified School District only) Children4 Percent of children in grades 5, 7 & 9 who are overweight (BMI above the 95th percentile) and Obese Adults1b Percent of adults who are overweight ( BMI < )
9 Rates of binge drinking,when calculated amongonly those who reportedany drinking in the pastmonth, were 32% amongadults and 49% amongteens (ages 14-17 years).1a & 3 Adult obesityincreasedfrom 14% in 1997 to19% in Adult obesitywas highestamong African-Americans(31%) followed byLatinos (24%), Whites(16%), and Asians/PacificIslanders (6%).1b 25% of boys and 18% of girls attending publicschools in grades 5, 7 and 9 are Physical activitydoes nothave to be strenuous inorder to be in 30 minutesof moderate physicalactivity( , walking)each day improves healthand reduces the risk ofdeveloping There are over one million adult smokersin Los Angeles Adult cigarette smokingdecreased from 18% in1999 to 16% in The rate of smokingamong men (20%) isnearly twice that ofwomen (11%).
10 1 Among women, rates of smokingare higheramong African-Americans(19%) and Whites (16%)compared to Asians/Pacific Islanders (7%) and Latinas (7%).1 Percent of adults who are obese (BMI 30) Activity Percent of adults who are physically active obtain recommended amount of exercise each week1 Percent of adults who are sedentary1 Percent of adults who consume five or more servings of fruits and vegetables a were not available where noted =SPA statistically better off than the County average (p< )=SPA statistically worse off than the County average (p< )N/A Conditions in the social and physical environmentexert powerful influences on individual to maximize the HEALTH of the populationmust include policies and other interventions thatsupport family and neighborhood cohesion,strengthen social networks, improve educationalopportunities, foster a strong economy.