Transcription of Indonesia - OECD
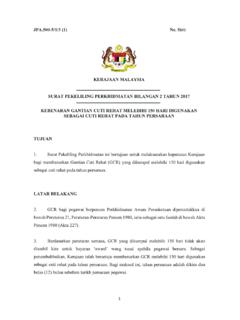
1 The Programme for International Student Assessment (PISA) is a triennial survey of 15-year-old students that assesses the extent to which they have acquired the key knowledge and skills essential for full participation in society. The assessment focuses on proficiency in reading, mathematics, science and an innovative domain (in 2018, the innovative domain was global competence), and on students well-being. Indonesia What 15-year-old students in Indonesia know and can do Figure 1. Snapshot of performance in reading, mathematics and science Note: Only countries and economies with available data are shown. Source: OECD, PISA 2018 Database, Tables and Students in Indonesia scored lower than the OECD average in reading, mathematics and science. Compared to the OECD average, a smaller proportion of students in Indonesia performed at the highest levels of proficiency (Level 5 or 6) in at least one subject; at the same time a smaller proportion of students achieved a minimum level of proficiency (Level 2 or higher) in at least one subject.
2 2 | Indonesia - Country Note - PISA 2018 Results OECD 2019 Volumes I-III What students know and can do in reading In Indonesia , 30% of students attained at least Level 2 proficiency in reading (OECD average: 77%). At a minimum, these students can identify the main idea in a text of moderate length, find information based on explicit, though sometimes complex criteria, and can reflect on the purpose and form of texts when explicitly directed to do so. Some a negligible percentage of students in Indonesia were top performers in reading, meaning that they attained Level 5 or 6 in the PISA reading test (OECD average: 9%). At these levels, students can comprehend lengthy texts, deal with concepts that are abstract or counterintuitive, and establish distinctions between fact and opinion, based on implicit cues pertaining to the content or source of the information. In 20 education systems, including those of 15 OECD countries, more than 10% of 15-year-old students were top performers.
3 What students know and can do in mathematics Some 28% of students in Indonesia attained Level 2 or higher in mathematics (OECD average: 76%). At a minimum, these students can interpret and recognise, without direct instructions, how a (simple) situation can be represented mathematically ( comparing the total distance across two alternative routes, or converting prices into a different currency). The share of 15-year-old students who attained minimum levels of proficiency in mathematics (Level 2 or higher) varied widely from 98% in Beijing, Shanghai, Jiangsu and Zhejiang (China) to 2% in Zambia, which participated in the PISA for Development assessment in 2017 . On average across OECD countries, 76% of students attained at least Level 2 proficiency in mathematics. In Indonesia , around 1% of students scored at Level 5 or higher in mathematics (OECD average: 11%). Six Asian countries and economies had the largest shares of students who did so: Beijing, Shanghai, Jiangsu and Zhejiang (China) (44%), Singapore (37%), Hong Kong (China) (29%), Macao (China) (28%), Chinese Taipei (23%) and Korea (21%).
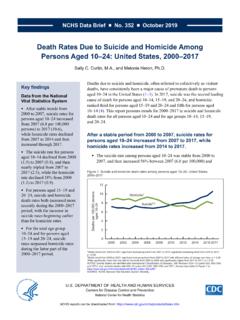
4 These students can model complex situations mathematically, and can select, compare and evaluate appropriate problem-solving strategies for dealing with them. What students know and can do in science Some 40% of students in Indonesia attained Level 2 or higher in science (OECD average: 78%). At a minimum, these students can recognise the correct explanation for familiar scientific phenomena and can use such knowledge to identify, in simple cases, whether a conclusion is valid based on the data provided. In Indonesia , a negligible percentage of students were top performers in science, meaning that they were proficient at Level 5 or 6 (OECD average: 7%). These students can creatively and autonomously apply their knowledge of and about science to a wide variety of situations, including unfamiliar ones. Indonesia - Country Note - PISA 2018 Results | 3 Volumes I-III OECD 2019 Performance trends Figure 2.
5 Trends in performance in reading, mathematics and science Notes:*indicates mean-performance estimates that are statistically significantly above or below PISA 2018 estimates for Indonesia . The blue line indicates the average mean performance across OECD countries with valid data in all PISA assessments. The red dotted line indicates mean performance in Indonesia . The black line represents a trend line for Indonesia (line of best fit). Source: OECD, PISA 2018 Database, Tables I. , I. and I. Indonesia has participated in PISA since 2001. Since that time, performance in science has fluctuated but remained flat overall, while performance in both reading and mathematics has been hump-shaped. Reading performance in 2018 fell back to its 2001 level after a peak in 2009, while mathematics performance fluctuated more in the early years of PISA but remained relatively stable since 2009.
6 However, these results must be seen in the context of the vast strides that Indonesia has made in increasing enrolment. In 2001, the PISA sample covered only 46% of 15-year-olds in Indonesia ; in 2018,85% of 15-year-olds were covered. It is often the case that the strongest students remain in education, and that students who were not in education and were brought into the school system are weaker than those who were already included. If there had been no improvement in the education system, the inclusion of more students would be expected to lower mean performance and the performance distribution. In that light, in maintaining education standards over its participation in PISA, Indonesia has been able to raise the quality of its education system. Trends adjusted for enrolment show this more clearly. On the assumption that the 15-year-olds who were excluded from the PISA sample would have performed below the 75th percentile of all 15-year-olds if they had sat the assessment, the mathematics and science performance of the highest-achieving 25% amongst all 15-year-olds in Indonesia would have improved by 11 points every three years since 2003.
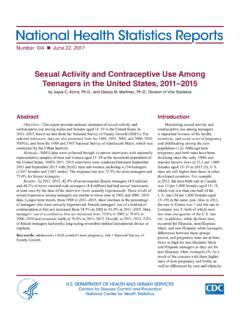
7 4 | Indonesia - Country Note - PISA 2018 Results OECD 2019 Volumes I-III Where All Students Can Succeed Figure 3. Differences in performance related to personal characteristics Notes: Only countries and economies with available data are shown. (1) Girls minus boys performance; (2) Advantaged minus disadvantaged students performance; (3) Immigrants minus non-immigrants performance in reading; After accounting for students' and schools' socio-economic profile. Source: OECD, PISA 2018 Database, Tables , , , and Equity related to socio-economic status In Indonesia , socio-economically advantaged students outperformed disadvantaged students in reading by 52 score points in PISA 2018. This is smaller than the average difference between the two groups (89 score points) across OECD countries. In PISA 2009, the performance gap related to socio-economic status was 44 score points in Indonesia (and 87 score points on average across OECD countries).
8 Socio-economic status was a strong predictor of performance in mathematics and science in all PISA participating countries. It explained 7% of the variation in mathematics performance in PISA 2018 in Indonesia (compared to 14% on average across OECD countries), and 7% of the variation in science performance (compared to the OECD average of 13% of the variation). Some 14% of disadvantaged students in Indonesia were able to score in the top quarter of reading performance within Indonesia , indicating that disadvantage is not destiny. On average across OECD countries, 11% of disadvantaged students scored amongst the highest performers in reading in their countries. Indonesia - Country Note - PISA 2018 Results | 5 Volumes I-III OECD 2019 Figure 4. School segregation, and gap in material and staff shortage between advantaged and disadvantaged schools Notes: Only countries and economies with available data are shown.
9 The isolation indices ranging from 0 (no segregation) to 1 (full segregation) measure whether low-/high-performing students or disadvantaged students are more or less concentrated in some schools. See detailed description of the indices in Volume II Chapter 4. Source: OECD, PISA 2018 Database, Tables , , and In Indonesia , low-performing students are clustered in certain schools to the same extent as the OECD average, and high-performing students more often clustered. A disadvantaged student has a 15% chance, on average, of being enrolled in a school with those who score in the top quarter of reading performance (OECD average: a 17% chance). School principals in Indonesia reported more staff shortage and more material shortage than the OECD average; and school principals of disadvantaged schools more often reported staff shortage than principals of advantaged schools.
10 In Indonesia , 64% of students enrolled in a disadvantaged school and 31% of students enrolled in an advantaged school attend a school whose principal reported that the capacity of the school to provide instruction is hindered at least to some extent by a lack of teaching staff. On average across OECD countries, 34% of students in disadvantaged schools and 18% of students in advantaged schools attend such a school. According to school principals in Indonesia , 65% of teachers in advantaged schools and 44% of teachers in disadvantaged schools are fully certified . The proportions of teachers with at least a master s degree are larger in advantaged schools than in disadvantaged schools. Equity related to gender In all countries and economies that participated in PISA 2018, girls significantly outperformed boys in reading by 30 score points on average across OECD countries.