Transcription of Industry Financial Report
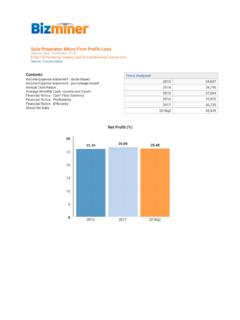
1 Industry Financial Report release date: June 2018. ALL US. [238220] Plumbing, Heating, and Air-Conditioning Contractors Sector: Construction Sales Class: $5m - $ Contents Firms Analyzed Income-Expense statement - dollar-based 2013 2,979. Income-Expense statement - percentage-based Balance Sheet - dollar-based 2014 2,814. Balance Sheet - percentage-based 2015 2,392. Sources-Uses of Funds Financial Ratios - Cash Flow-Solvency 2016 2,214. Financial Ratios - Profitability 2017 2,153. Financial Ratios - Efficiency-Debt-Risk Financial Ratios - Turnover About the Data Time Series: Financial reports analyze calendar years as displayed.
2 Our winter release reports display an additional, overlapped year running from the end of the second quarter of the prior year to the end of the second quarter of the release year. Discretionary Owner Earnings (%). 7 6. 5. 4. 3. 2. 1. 0 2015 2016 2017. 1. Income and Expense- Profit and Loss $. 2013 2014 2015 2016 2017. Business Revenue 7,452,713 7,094,022 8,019,377 8,001,022 8,123,908. Cost of Sales 5,303,351 5,106,986 5,636,820 5,632,720 5,701,358. Cost of Sales - Labor Portion 3,379,314 3,144,677 3,308,308 3,432,158 3,452,313. Gross Margin 2,149,362 1,987,036 2,382,557 2,368,302 2,422,550. Officers Comp. 298,109 292,983 299,925 301,639 312,770.
3 Salary-Wages 505,294 466,787 574,989 578,474 598,732. Rent 153,526 129,821 131,518 132,017 136,482. Taxes Paid 190,789 186,573 228,552 229,629 238,030. Advertising 78,999 46,821 101,044 101,613 105,611. Benefits-Pensions 208,676 162,453 242,987 244,831 253,466. Repairs 37,264 17,026 21,652 21,603 22,747. Bad Debt 22,358 8,513 13,633 13,602 13,811. Sales, General, Admin & Misc. 412,135 393,009 481,163 475,261 492,309. EBITDA 242,212 283,050 287,094 269,634 248,592. Amortization Depreciation Depletion 78,999 56,752 65,759 66,408 69,053. Operating Expenses 1,986,149 1,760,738 2,161,222 2,165,077 2,243,011. Operating Income 163,213 226,298 221,335 203,226 179,539.
4 Interest Income 1,491 1,419 802 800 812. Interest Expense 21,613 13,479 24,860 25,603 26,809. Other Income 43,971 41,145 41,701 44,006 43,869. Pre-Tax Net Profit 187,062 255,383 238,978 222,429 197,411. Income Tax 56,205 82,849 76,451 69,997 60,240. After Tax Net Profit 130,857 172,534 162,527 152,432 137,171. Discretionary Owner Earnings 507,965 522,269 528,211 520,479 518,994. 2. Income and Expense- Profit and Loss %. 2013 2014 2015 2016 2017. Business Revenue Cost of Sales Cost of Sales - Labor Portion Gross Margin Officers Comp. Salary-Wages Rent Taxes Paid Advertising Benefits-Pensions Repairs Bad Debt Sales, General, Admin & Misc.
5 EBITDA Amortization Depreciation Depletion Operating Expenses Operating Income Interest Income Interest Expense Other Income Pre-Tax Net Profit Income Tax After Tax Net Profit Discretionary Owner Earnings 3. Dollar-based sales and other dollar-based data in this Report reflect averages for sales of the Industry segment, not total Industry -wide averages. As a result, sales levels may vary from year to year, depending on the mix of firms that fall within the selected segment. In local Industry Financial reports, the "Other Income" line item percentage is applied directly from US averages for this Industry . Local percentages may differ.
6 Other P&L percentages and all dollar calculations are based on actual local data. Business Revenue includes receipts from core business operations. Interest Income and Other income (such as rents and royalties) are generally detailed separately below Operating Income. While Business Revenue is separated from Interest Income for most classifications, Business Revenue includes interest income from the private sector where it is central to Financial Industry operations, including Finance and Insurance (NAICS 52xxxx except NAICS 5242xx Insurance Brokers and Other Insurance Activities); Real Estate-Rental-Leasing (53xxxx); and Management of Companies and Enterprises (55xxxxx).
7 Cost of Sales includes materials and labor involved in the direct delivery of a product or service. Other costs are included in the cost of sales to the extent that they are involved in bringing goods to their location and condition ready to be sold. Non- production overheads such as development costs may be attributable to the cost of goods sold. The costs of services provided will consist primarily of personnel directly engaged in providing the service, including supervisory personnel and attributable overhead. Gross Margin represents direct operating expenses plus net profit. In addition to the labor portion of Cost of Sales, wage costs are reflected in the Officers Compensation and Wages-Salary line items.
8 In many cases, SG&A (Sales, General and Administrative) costs also include some overhead, administrative and supervisory wages. Rent covers the rental cost of any business property, including land, buildings and equipment. The Taxes Paid line item includes payroll other paid-in tax items, but not business income taxes due for the period. Although it can be calculated in many ways and is a controversial measure, the EBITDA line item (Earnings before Interest Expense, income tax due, Depreciation and Amortization) adds back interest payments, depreciation, amortization and depletion allowances, and excludes income taxes due to reduce the effect of accounting decisions on the bottom line of the Profit and Loss Statement.
9 Since some firms utilize EBITDA to "add back" non-cash and flexible expenses which may be altered through credits and accounting procedures (such as income tax), paid-in income taxes from the Taxes Paid line item are not added back in the EBITDA calculation. Advertising includes advertising, promotion and publicity for the reporting business, but not on behalf of others. Benefits-Pension includes, but is not limited to, employee health care and retirement costs. In addition to varying proportions of overhead, administrative and supervisory wages, some generally more minor expenses are aggregated under SG&A (Sales, General and Administrative).
10 Operating Expenses sums the individual expense line items above, yielding the Operating Income or net of core business operations, when subtracted from the Gross Margin. Pre-Tax Net Profit represents net profit before income tax due. Income Tax calculates the federal corporate tax rate before credits, leaving After-Tax Profit at the bottom line. Discretionary Owner Earnings sums Officer Compensation, Depreciation and related non-cash expenses and Net Profit after business taxes to represent a practical measure of total return to owners. The metric is mainly used for small businesses. 4. Balance Sheet - dollar-based Assets 2013 2014 2015 2016 2017.