Transcription of Initial Public Offerings: Updated Statistics
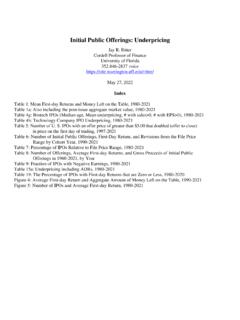
1 1 Initial Public Offerings: Updated Statistics Jay R. Ritter Cordell Eminent Scholar, Eugene F. Brigham Department of Finance, Insurance, and Real Estate Warrington College of Business, University of Florida voice April 8, 2022 Table 1: Mean First-day Returns and Money Left on the Table, 1980-2021 Table 1a: Also including the post-issue aggregate market value, 1980-2021 Table 2: Mean First-day Returns, Categorized by Sales, for IPOs from 1980-2021 Table 3: First-day Turnover Categorized by Decade and First-Day Return, 1983-2021 Table 3b: First-day Turnover Categorized by NYSE and Nasdaq Listings, 1983-2021 Table 4: Median Age and Fraction of IPOs with VC- and Buyout-backing, 1980-2021 Table 4a: Median Price-to sales Ratios of Tech-stock IPOs, 1980-2021 Table 4b: Profitability and Median Sales of Technology and Biotech IPOs, 1980-2021 Table 4c: The number of VC-, Growth Capital-, and Buyout-backed IPOs, 1980-2021 Table 4d.
2 VC-backed IPOs, restricted to those headquartered in the , 1980-2021 Table 4e: Proceeds and Post-issue market value of tech stock IPOs, 1980-2021 Table 4f: Mean and Median inflation-adjusted Proceeds and Market Cap, 1980-2021 Table 4g: Biotech IPOs (Median age, Mean underpricing, # with sales>0, # with EPS>0), 1980-2021 Table 4h: Technology Company IPO Underpricing, 1980-2021 Table 5: Number of U. S. IPOs with an offer price of greater than $ that doubled (offer to close) in price on the first day of trading, 1997-2021 Table 6: Number of Initial Public Offerings, First-Day Return, and Revisions from the File Price Range by Cohort Year, 1990-2021 Table 7: Percentage of IPOs Relative to File Price Range, 1980-2021 Table 8: Number of Offerings, Average First-day Returns, and Gross Proceeds of Initial Public Offerings in 1960-2021, by Year Table 9: Fraction of IPOs with Negative Earnings, 1980-2021 Table 10: Gross Spreads Continue to Remain at 7% on Moderate-Size Deals, 2001-2021 Table 11: Mean and Median Gross Spreads and Number of Managing Underwriters, 1980-2021 Table 12: Number of IPOs Categorized by the LTM Sales Over/Under $50 million (2005 $), 1980-2021 Table 12a.
3 Median Market Cap and Pre-IPO Sales (2005 $), and Median Price-to-sales ratio, 1980-2021 Table 12b: Number of IPOs Categorized by the LTM Sales Over/Under $1 billion (2011 $), 1980-2021 Table 13: IPO Auctions in the , 1999-2021 Table 13a: Direct Listings in the , 2018-2021 Table 14: The Market Share of Foreign Companies Among Listings, 1980-2021 Table 15: How Many IPOs are There? 1980-2021 Table 15a: Closed-end Funds, REITs, and SPACs, and IPO Volume and Average First-day Returns with Banks, LPs, and ADRs Included, 1980-2021 Table 15b: SPACs, 1990-2021 Table 16: Long-run Returns on IPOs Categorized by the Pre-issue Sales of the Firm, 1980-2020 Table 16a: Long-run Returns on IPOs Categorized by $1 Billion Sales of the Firm, 1980-2020 Table 16b: Long-run Returns on IPOs Categorized by the Profitability of the Firm, 1980-2020 Table 16c: Long-run Returns Measured from the Offer Price on Tech and non-Tech Stock IPOs Excluding the Internet Bubble, 1980-2019 Table 16d: Long-run Returns Measured from the First Closing Market Price on Tech and non-Tech Stock IPOs Excluding the Internet Bubble, 1980-2019 Table 16e: Distribution of 5-year Buy-and-Hold Returns on IPOs, 1975-2015 Table 16f.
4 Aftermarket Returns with and without Including the First-day Return, 1980-2020 2 Table 17: Long-run Returns on IPOs Categorized by VC-backing or Buyout Fund-backing Table 17a: Long-run Returns on IPOs Categorized by VC-, Growth Capital-, or Buyout Fund-backing Table 18: Long-run Returns on IPOs Categorized by VC-backing, by Subperiod Table 19: Table I of Ritter and Welch 2002 Journal of Finance article: Number of IPOs, First-day Returns, and Long Run Performance, 1980 to 2020 (returns through Dec. 31, 2021) Table 20: Returns by Event Year for the First Five Years after the IPO for IPOs from 1980-2019 Table 21: Mean and Median Public Float, 1980-2021 Table 22: Non-distress Delistings within Three Years of the IPO Table 23: Dual Class IPOs, by Tech and Non-tech,1980-2021 Table 24: Long-run Returns for Dual Class and Single Class IPOs Figure 1: First-day Turnover Categorized by Decade and First-Day Return, 1983-2018 Figure 2: Fraction of IPOs with Negative EPS and Fraction of Tech Stocks, 1980-2021 Figure 3: Mean and Median Public Float, 1980-2021 Figure 4: Average First-day Return and Aggregate Amount of Money Left on the Table, 1990-2021 Figure 5: Number of IPOs and Average First-day Return, 1980-2021 Figure 6.
5 Number and Percentage of IPOs from Chinese Companies, 1990-2021 311 operating companies went Public in the in 2021, excluding ADRs, natural resource limited partnerships and trusts, closed-end funds, REITs, SPACs, banks and S&Ls, unit offers, penny stocks (offer price of less than $5 per share), and stocks not listed on Nasdaq or the NYSE (including NYSE MKT LLC, the former American Stock Exchange). For 2016, I have included BATS Global Markets, which went Public in April, but was listed on BATS before being acquired by CBOE Holdings in 2017. Of these 311 operating companies, 262 were from the A higher volume figure has been reported in many sources (over 1,000 counting all offerings), but the higher numbers typically include not only operating companies (mostly domestic), but also some companies that were already traded in other countries and are thus actually follow-on offerings, banks and S&Ls (11 offerings, most of which are typically mutual conversions with depositors buying the stock), oil & gas partnerships or unit trusts (0 offerings), ADRs (36 offerings), REITs (5 offerings), 613 special purpose acquisition companies (SPACs), 10 closed-end funds (not including interval funds listed at ), other unit offerings (1 offerings), IPOs that do not trade on the NYSE (including NYSE MKT) or Nasdaq (0 offerings), IPOs with an offer price below $ (12 offering)
6 , and small best efforts deals (8 offerings, not all of which were small, but all but one were banks). There were also 6 direct listings. There are also several bulletin board-traded issues that I (and Dealogic) classify as follow-ons, and thus don t count, but which Thomson-Reuters classifies as IPOs. Note: Many of these tables have been Updated to include 2021 numbers with the assistance of Da Tian. Some of the tables may have slightly different counts for the number of IPOs in some years. These inconsistencies are because I periodically add or delete a company that had been misclassified or find some missing data. I do not immediately update every table. I rely on data from Thomson Reuters (SDC) and Dealogic, but also use information from and Renaissance Capital and the prospectuses, and other sources. For IPOs from June 1996 and later, the prospectuses ( form 424B) are available on EDGAR.
7 For IPOs from 1975-1996 (the pre-EDGAR days), I have most of the original paper prospectuses courtesy of Graeme Howard and Todd Huxster. For foreign IPOs from 1996-2000, the did not require electronic filing, so they are not available on EDGAR, but I have the paper copies for many of them. In almost all of my tables, I use a more conservative definition of what is an IPO than most other data providers. Partly, the definition that is appropriate depends upon what one is focusing on. From an underwriter s point of view, anything that generates fees is relevant. I exclude some of these categories (such as LPs) partly because it is difficult to determine the founding date of the underlying assets, and I do not like to have a different number of firms in different tables. Another motivation is that I am focusing on operating companies that potentially create jobs. 3 Table 1: Mean First-day Returns and Money Left on the Table, 1980-2021 ( Updated February 16, 2022) The sample is IPOs with an offer price of at least $ , excluding ADRs, unit offers, closed-end funds, REITs, natural resource limited partnerships, small best efforts offers, banks and S&Ls, and stocks not listed on CRSP (CRSP includes Amex, NYSE, and NASDAQ stocks).
8 Proceeds exclude overallotment options. The amount of money left on the table is defined as the closing market price on the first-day of trading minus the offer price, multiplied by the shares offered. Year Number of IPOs Mean First-day Return Aggregate Amount Left on the Table Aggregate Proceeds Equal-weighted Proceeds-weighted 1980 71 $ billion $ billion 1981 192 $ billion $ billion 1982 77 $ billion $ billion 1983 451 $ billion $ billion 1984 171 $ billion $ billion 1985 186 $ billion $ billion 1986 393 $ billion $ billion 1987 285 $ billion $ billion 1988 105 $ billion $ billion 1989 116 $ billion $ billion 1990 110 $ billion $ billion 1991 286 $ billion $ billion 1992 412 $ billion $ billion 1993 510 $ billion $ billion 1994 402 $ billion $ billion 1995 462 $ billion $ billion 1996 677 $ billion $ billion 1997 474 $ billion $ billion 1998 281 $ billion $ billion 1999 476 $ billion $ billion 2000 380 $ billion $ billion 2001 80
9 $ billion $ billion 2002 66 $ billion $ billion 2003 63 $ billion $ billion 2004 173 $ billion $ billion 2005 159 $ billion $ billion 2006 157 $ billion $ billion 2007 159 $ billion $ billion 2008 21 $ billion $ billion 2009 41 $ billion $ billion 2010 91 $ billion $ billion 2011 81 $ billion $ billion 2012 93 $ billion $ billion 2013 158 $ billion $ billion 2014 206 $ billion $ billion 2015 118 $ billion $ billion 2016 75 $ billion $ billion 2017 106 $ billion $ billion 2018 134 $ billion $ billion 2019 112 $ billion $ billion 2020 165 $ billion $ billion 2021 311 $ billion $ billion 1980-1989 2,047 $ billion $ billion 1990-1998 3,614 $ billion $ billion 1999-2000 856 $ billion $ billion 2001-2021 2,569 $ billion $ billion 1980-2021 9,086 $ billion $1, billion 4 Table 1a ( Updated February 16, 2022) Mean First-day Returns and Money Left on the Table, 1980-2021 The market value includes the market value of all share classes using the post-issue no.
10 Of shares. Year Number of IPOs Mean First-day Return Aggregate Amount Left on the Table Aggregate Proceeds Market value at 1st closing market price Equal-weighted Proceeds-weighted 1980 71 $ billion $ billion $ billion 1981 192 $ billion $ billion $ billion 1982 77 $ billion $ billion $ billion 1983 451 $ billion $ billion $ billion 1984 171 $ billion $ billion $ billion 1985 186 $ billion $ billion $ billion 1986 393 $ billion $ billion $ billion 1987 285 $ billion $ billion $ billion 1988 105 $ billion $ billion $ billion 1989 116 $ billion $ billion $ billion 1990 110 $ billion $ billion $ billion 1991 286 $ billion $ billion $ billion 1992 412 $ billion $ billion $ billion 1993 510 $ billion $ billion $126 billion 1994 402 $ billion $ billion $64 billion 1995 462