Transcription of INTANGIBLE ASSETS AND INTELLECTUAL CAPITAL …
1 INTANGIBLE ASSETS AND INTELLECTUAL CAPITALAS KEY FACTORS OF ROMANIA S CONVERGENCE*MARTA-CHRISTINA SUCIUThe main aim of the chapter is to provide the readers with a synthesis of the new internationalframework of debate dedicated to the topics of INTANGIBLE ASSETS and INTELLECTUAL thetopics of the whole book, this chapter is focussed on the role played by INTANGIBLE ASSETS andintellectualcapital for attaining convergence and for increasing :convergence, knowledge-based economy, competitiveness, competitive advantage, INTANGIBLE ASSETS , INTELLECTUAL : E24; I23; I28; J24; O15; targets and the European common objectivesfor permanent education and trainingAs part ofthe Lisbon strategy, the Barcelona Summit of 2002 endorsedcommon objectives for Education and Training in Lisbon EuropeanCouncil of May 2003 agreed on five targets to be met by 2010 percentage of early school leavers should be at most 10% on the least 85% of the 22-year-olds in the European Union should havecompleted upper secondary education or higher percentage of low-achieving 15-year-olds in reading literacy in theEuropean Union should have decreased by at least 20%, compared to theyear European Union average level of participation in lifelong learning shouldbe at least of the adult working age population (25-64 years).
2 Total number of graduates in mathematics, science and technology(MS&T) in the European Union should increase by at least 15% while atthe same time the gender imbalance should last report of European Union Commission called Progress towards theLisbon objectives in education and training (the fourth report from the reports of2004, 2005, 2006 and 2007) analyses the performance and progress towards theLisbon objectives in education and training. On the 25th of May 2007 theEuropeanCouncil on Educationhas introduced 16 core indicators recommended to be used* Study within the CEEX Programme Project No. 220/2006 Economic Convergence andRole of Knowledge in Relation to the EU Integration .Marta-Christina Suciu2in order to monitor the progress with respect to Lisbon objectives in education andtraining (Commission Staff Working Document Progress Towards the LisbonObjectives in Education and Training Indicators and Benchmarks 2007).
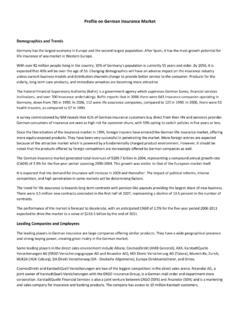
3 According to available data we will try to analyze Romania s position accordingto the Lisbon targets concerning education and training achievements in percentage of early school leavers should be at most 10%on the averageEarly school leavers refers to persons aged 18 to 24 in the following twoconditions: either the respondents declared that the highest level of education ortraining attained is, according to international UNESCO classification, ISCED 0, 1,2 or 3c short, or the respondents declared not having received any education ortraining in the four weeks preceding the survey. The denominator consists of thetotal population of the same age group. Based onEurostat Yearbook, Figure 1presents Romanian position according to thepercentage of early school index affects in a negative way investments in human CAPITAL and the generallevel of education of the : Europe in Figures - Eurostat Yearbook 2006-07, p.
4 1. Early school leavers, 2005 (% of the population aged 18 to 24 with at most lower secondaryeducation and not in further education or training), in %.In Romania the percentage of early school leaversismore than double theLisbon target established for 2010 at a level of most 10% on the average. In 2005it was % on the average and it diminished as compared to 2000 ( ). Butit is much lower if compared to countries like Turkey, Portugal, Malta, Spain,Cyprus, Italy. On the other hand, there are countries that have reached this targetIntangible ASSETS and INTELLECTUAL capital3and have now a lower level (Norway, Croatia, Switzerland, Slovenia, Slovakia,Czech Republic, Poland, Sweden, Austria, Denmark, Finland).The gender distribution for this index in Romania was in 2005: 20,1% forfemale and correspondingly % for male. There are countries where there aregender gaps regarding this index: Turkey (where for male the rate is greater than50%), Portugal, Malta, Spain, Cyprus, Italy, Greece.
5 In the last report published byUE in October 2007, Romania and Bulgaria have a defavourable situationaccording to the first objective-early school leavers- with percentages of 19%,respectively 18%. However, in 2007 on the last positions there are countries suchas Malta and Portugal, with percentages of and But, in the case ofother countries, such as Czech Republic, Poland and Slovacia the percentagescorresponding to the first Lisbon objective were , and respectively least 85% of the 22-year-olds in the European Union should havecompleted upper secondary education or higher order to analyze the second Lisbon target we take first into account two indexes: The median age of a given populationis the age separating the group intotwo halves of equal size; in the case of this indicator it means that half ofthe student population, persons enrolled in tertiary education (ISCED levels 5 and 6 under international classification), is younger than themedian age and the other half is older (Figure 2).
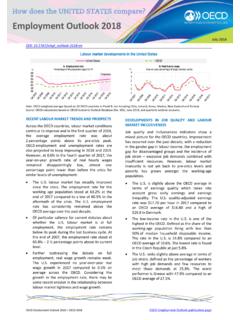
6 The indicator youth education attainment level is defined as thepercentage of young people aged 20 to 24 years having attainedat leastupper secondary education level, with an education level ISCED (3a,3b or 3c long); the denominator consists of the total population of thesame age group (Figure 3).Source: Europe in Figures - Eurostat Yearbook 2006-07, p. 88 Figure 2. Median age in tertiary education, 2004 (years old).Marta-Christina Suciu4In Romaniamedian age in tertiary education was in 2004(increasing as compared to years old in 1999).It is quite close to the average values in EU-25 ( ) and EU-15( ). There are countries with a higher value such as: Sweden ( -year-old), Denmark ( ), Finland ( ). There are countrieswith lower levels such as Turkey and Croatia ( ).In Romaniayouth education attainment level was % in 2005 ascompared to % in 2000 - Figure top of youth education attainment level91.
7 590 .690 .39 087 .886 .185 .985 .284 .88 483 .382 .881 .880 .980 .780 .377 .17 674 .672 .971 .17 161 .348 .448 .176 .976 .875 .20102030405060708090100S l o v a c i aS l ov e n i aCi p r uPo l o ni aS u e d i aI r l a nd aAustri aL i t ua ni aF i n l a n d aGr e c i aUng ar i aF r a n t aL e t o n i aEs t o n i aCehiaBelgiaMa r ea Br i t an i eD a n e ma r c aOl a nd aItaliaL ux e mb ou r gGe r ma ni aS p a n i aPortugal i aMaltaU E 2 5Bu l ga r i aR o m a n i a%Source: 3. Youth education attainment level (in %, in several countries of EU).We also consider useful to look for another index: 18-year-olds in take this into account because the cohort of school age population that was 18years old in 2004 will have in 2010 the age of 24 years (Figure 4).Source: Europe in Figures - Eurostat Yearbook 2006-07, p. 88 Figure 4. 18-year-olds in education, 2004 (% of all 18-year-olds). INTANGIBLE ASSETS and INTELLECTUAL capital5At the European level, according to the last report from Octomber 2007, it isestimated that more than 2 million people will have to graduate the high school,such as to register a higher percentage of graduates from the secondary level and toget close to the objective of 85% until 2010.
8 Countries that are on the top accordingto this objective are Czech Republic, with a percentage of 91,8%, Polonia with91,7% and Slovacia with 91,5%.Regarding convergence with respect to thisLisbon target we can see that Romania has now a lower level than both EU-25 andEU-15 on the are countries where this target has been reached (Sweden followed b yFinland, Czech Republic, Belgium, Norway) or countries that are very close to thetarget (Lithuania, Slovenia, Poland, Germany, Ireland, Latvia, Slovakia, Denmark,Estonia, France, Netherlands). percentage of low-achieving 15-year-olds in reading literacy in theEuropean Union should have decreased by at least 20%, compared to theyear 2000In Table 1 we present the literacy rates in Romania compared to the EUaverage 1 Literacy rates, selected years, youth and adult populationLiteracy rates 19902000-20042000-2004 European countries Adult(15+)1% Youth(15-24)2% :1 Considering this category we take into account people over this category we take into account people belonging to the 15-24 year age : in Table 1 are quite comparable for Romania and the EU the lower level for youth population should be an alarm signal for thepolicy makers in education mostly because the Lisbon target is to diminishthese values in 2010 by at least 20% compared to the year 2000.
9 We consider ituseful to look also at TIMSS (Third International Mathematics and ScienceStudy) that illustrates the number of students who received grade eight inscience and mathematics assessments (Table 2):Marta-Christina Suciu6 Table 2 TIMS eight grade students assessment results for science and math for selected countries, 1995, 1999 and 2003 CountryMathematics mean scoreScience mean score1995 1999 2003 1995 1999 2003 Czech Republic546 520 555 539 Republic534 534 5+8 532 535 517 Hungary527 532 529 537 552 543 Bulgaria527 511 476 545 518 479 Slovenia494 493 514 520 Latvia488 505 505 476 503 513 Romania474 472 475 471 472 470 Lithuania472 482 502 464 488 519 Source.
10 Nicholas Barr (ed),Labour Markets and Social Policy in CEE, World Bank, two international assessments -Third International Mathematics andScience Study-TIMSS and PISA(Programme for International Student Assessment) -show a more negative picture as compared to the previous s eight grade students participated in the TIMSS in 1995 (before thereform), 1999 (when the reform was implemented) and 2003 illustrate thatRomanian students performed less in mathematics and science disciplines for eachof the three rounds than the average of participating European and Central Asiancountries. Particularly disturbing is that about 70 % of Romania s 15-year-oldsperformed below level 3 - that is, at levels 0, 1, or 2. Scoring at level 3 or highergenerally seems required in a modern economy and survey1 that included more European countries illustrates that Romania is inthe middle of this ranking system regarding the number of teaching staffcorresponding to 100 pupils andPISA registrations regarding reading Romania the values corresponding to the two indicators were , ; countries such as Czech Republic, Latvia and Finland had maximum valuesfor both indicators.