Transcription of INTERNATIONAL JOURNAL OF SCIENTIFIC & …
1 INTERNATIONAL JOURNAL OF SCIENTIFIC & TECHNOLOGY RESEARCH VOLUME 3, ISSUE 2, FEBRUARY 2014 ISSN 2277-8616 91 IJSTR 2014 Problem Solving Management Using Six Sigma Tools & Techniques Mallikarjun Koripadu, K. Venkata Subbaiah Abstract: Problem Management is one of the most important process areas in today s service sectors ( IT, Healthcare, and Non IT business) apart from production & manufacturing sectors. Problem management ensures to streamline and identify the root causes (main reasons) and provide permanent and temporary solutions to recurring incidents there by reducing the infrastructure downtime/productivity loss. Proactive problem solving management can eliminate reducing incidents from occurring.
2 However, many times due to improper usage or not using any tools and techniques of problem management is ineffective. This paper explains how Lean and six sigma tools and techniques can be effectively used for doing a proactive problem solving management with higher benefits along with improved efficiency and effectiveness. In this paper one IT IS environment of incident management problem has been resolved using problem solving management tools. Index Terms: Lean, Six Sigma, Process Quality Control, Fishbone, Pareto, Why-why analysis, problem solving. 1 INTRODUCTION Problem Solving is one of the most important process in IT IS domain.
3 For an effective problem management, it is very important to identify the Root Cause of the problem. Root cause(s) can be found only if we have a proper understanding of the process along with an expert usage of Six Sigma (SS) tools and techniques. Six Sigma tools are used as part of problem solving management in the IT IS incident management. This paper also tries to bridge the gap and showcase how problem management can be done more effectively using Six Sigma tools and techniques. Few of the most commonly used six sigma tools and techniques are: 1. Ishikawa diagrams (also known as fish bone diagram or cause and effect diagram) 2.
4 Pareto Chart analysis and 3. Why analysis All the above tools and techniques are described in detailed and used in a sample case below to identify the true reasons & improve productivity (efficiency) by implementing the improvements & streaming the process. It was observed that, in one of the IT IS account, the service desk and L2 team were getting high call/ incident volumes which was not able to close on time hence observed pile up (inventory) of calls/ incidents. Due to which the service desk and L2 team use to spend extra hours and utilization was above the set expectation. This has lead dissatisfaction and frustration in employees.
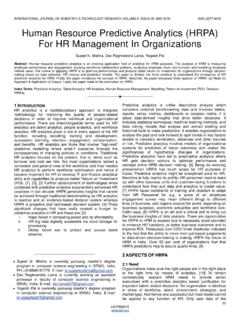
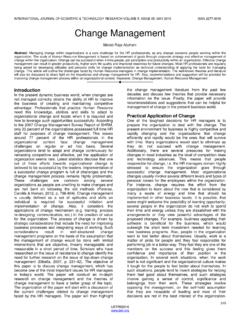
5 To address the same as part of problem management, a six sigma project was initiated to identify all the cause(s)/reason(s) for this problem high call volume using the basic six sigma tools and techniques listed above. 2 PROCEDURE: Ishikawa Diagram: This is also known as Cause & Effect Diagram, Fishbone Diagram, Ishikawa Diagram, Herringbone Diagram, and Ishikawa Diagram. When there is a recurring issue or problem, it is important to explore all reasons that could cause it, before you start to think about a solution. That way the problem can be solved completely. Cause and Effect Analysis gives a useful way of doing this.
6 This diagram-based technique, which combines brainstorming with a type of mind Map, pushes to consider all possible causes/reasons of a problem, rather than just the ones that are most obvious. Below steps can be followed to identify possible reasons for the problem. The problem mentioned above is used to explain the concept. 1. Firstly, identify the problem and write it in a box and draw an arrow pointing towards it. Think about the exact problem in detail. Where appropriate, identify who is involved, what the problem is, and when and where it occurs 2. Identify the major factors and draw four or more branches off the large arrow to represent main categories of potential causes.
7 Categories could include: Service Industries (The 4 Ps) Manufacturing Industries (The 6 Ms) Policies Procedures People Plant/Technology Machines Methods Materials Measurements Mother Nature(Environment) Manpower (People) _____ Mallikarjun Koripadu currently pursuing doctorate degree program in industrial engineering from Andhra University, India, PH +919886803069. E-mail: Dr. K. Venkata Subbaiah is working as a Professor in Mechanical Department in Andhra University, India, PH-+919848063452. E-mail: INTERNATIONAL JOURNAL OF SCIENTIFIC & TECHNOLOGY RESEARCH VOLUME 3, ISSUE 2, FEBRUARY 2014 ISSN 2277-8616 92 IJSTR 2014 3.
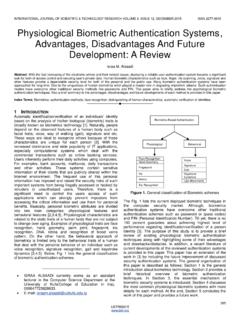
8 Brainstorm all the possible causes of the problem in each of the main categories and brainstorm possible causes of the problem. Explore each one to identify more specific 'causes of causes'. Continue branching off until every possible cause has been identified. Where a cause is complex, you might break it down into sub-causes. Show these as lines coming off each cause line. 4. Analyze the diagram. By this stage there should be a diagram showing all the possible causes of your problem. Pareto Chart: An Italian economist, Vilfredo Pareto (1848-1923), noticed a great inequality in the distribution of wealth.
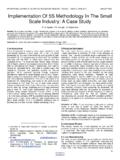
9 A few people owned most of the wealth. J. M. Juran found that this same phenomenon of the vital few and the trivial many applied to many areas of Statistical Process Control (SPC). He is credited with coining the terms Pareto chart and Pareto analysis to represent this phenomenon. Pareto analysis refers to the tendency for the bulk of the problems to be due to a few of the possible causes. Hence, by isolating and correcting the major problem areas, obtain the greatest increase in efficiency and effectiveness. The Pareto chart is a graphic display that emphasizes the Pareto principle using a bar graph in which the bars are arranged in decreasing magnitude.
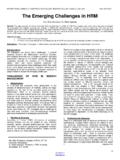
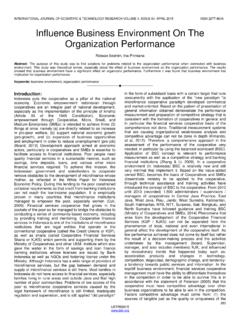
10 Below is the Pareto chart prepared for the above Fish-bone diagram. Once the fishbone complete, this leads to understanding all the root causes of the problem. If fishbone is done religiously, there is no possibility of missing any cause for the problem. From the above Pareto chart, it s concluded that Application freeze , LN Freeze and Citrix profile Issues constituted 80% of the problem. by targeting these 3 top causes, 80% of the problem will be resolved. Why-Why Analysis: It is a method of questioning that leads to the identification of the root cause(s) of a problem. A why-why is conducted to identify solutions to a problem that address it s root cause(s), rather than taking actions that are merely band-aids, a why-why helps to identify how to really prevent the issue from happening again.