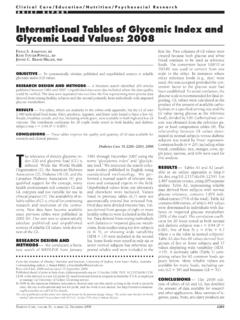
Transcription of International Tables of Glycemic Index and Glycemic Load ...
1 Clinical Care/Education/Nutrition/Psychosocial Research B R I E F R E P O R T. International Tables of Glycemic Index and Glycemic Load Values: 2008. FIONA S. ATKINSON, RD first list. Two columns of GI values were KAYE FOSTER-POWELL, RD created because both glucose and white JENNIE C. BRAND-MILLER, PHD bread continue to be used as reference foods. The conversion factor 100/70 or 70/100 was used to convert from one OBJECTIVE To systematically tabulate published and unpublished sources of reliable scale to the other. In instances where Glycemic Index (GI) values. other reference foods ( , rice) were used, this was accepted provided the con- RESEARCH DESIGN AND methods A literature search identified 205 articles version factor to the glucose scale had published between 1981 and 2007.
2 Unpublished data were also included where the data quality been established. To avoid confusion, the could be verified. The data were separated into two lists: the first representing more precise data glucose scale is recommended for final re- derived from testing healthy subjects and the second primarily from individuals with impaired glucose metabolism. porting. GL values were calculated as the product of the amount of available carbo- RESULTS The Tables , which are available in the online-only appendix, list the GI of over hydrate in a specified serving size and the 2,480 individual food items. Dairy products, legumes, and fruits were found to have a low GI.
3 GI value (using glucose as the reference Breads, breakfast cereals, and rice, including whole grain, were available in both high and low GI food), divided by 100. Carbohydrate con- versions. The correlation coefficient for 20 staple foods tested in both healthy and diabetic tent was obtained from the reference pa- subjects was r (P ). per or food composition Tables (8). The relationship between GI values deter- CONCLUSIONS These Tables improve the quality and quantity of GI data available for mined in normal subjects versus diabetic research and clinical practice. subjects was tested by linear regression. Diabetes Care 31:2281 2283, 2008 Common foods (n 20), including white bread, cornflakes, rice, oranges, corn, ap- ple juice, sucrose, and milk were used for T.
4 He relevance of dietary Glycemic in- 1981 through December 2007 using the this analysis. dex (GI) and Glycemic load (GL) is terms glyc(a)emic Index and glyc(a)e- debated. While the World Health mic load. We restricted the search to hu- RESULTS Tables A1 and A2 (avail- Organization (1), the American Diabetes man studies published in English using able in an online appendix at http://. Association (2), Diabetes UK (3), and the standardized methodology. We per- ) list Canadian Diabetes Association (4) give formed a manual search of relevant cita- 2,487 separate entries, citing 205 separate qualified support for the concept, many tions and contacted experts in the field.
5 Studies. table A1, representing reliable health professionals still consider GI and Unpublished values from our laboratory data derived from subjects with normal GL complex and too variable for use in and elsewhere were included. Values glucose tolerance, contains 1,879 indi- clinical practice (5). The availability of re- listed in previous Tables (6,7) were not vidual entries (75% of the total). table A2. liable Tables of GI is critical for continuing automatically entered but reviewed first. contains 608 entries, of which 491 values research and resolution of the contro- Final data were divided into two lists. Val- were determined in individuals with dia- versy.
6 New data have become available ues derived from groups of eight or more betes or impaired glucose metabolism since previous Tables were published in healthy subjects were included in the first (20% of the total). The correlation coeffi- 2002 (6). Our aim was to systematically list. Data derived from testing individuals cient for 20 foods tested in both normal tabulate published and unpublished with diabetes or impaired glucose metab- and diabetic subjects was r (P . sources of reliable GI values, with deriva- olism, from studies using too few subjects ; line of best fit y tion of the GL. (n 5), or showing wide variability where x is the value in normal subjects).
7 (SEM 15) were included in the second table A2 also lists 60 values derived from RESEARCH DESIGN AND list. Some foods were tested in only six or groups of five or fewer subjects and 57. methods We conducted a litera- seven normal subjects but otherwise ap- values displaying wide variability (SEM. ture search of MEDLINE from January peared reliable and were included in the 15). A summary table ( table 1) com- prising values for 62 common foods ap- From the Institute of Obesity, Nutrition and Exercise, University of Sydney, New South Wales, Australia. pears below. More reliable values are Corresponding author: J. Brand-Miller, available for many foods, including car- Received 8 July 2008 and accepted 13 September 2008.
8 Rots (GI 39) and bananas (GI 51). Published ahead of print at on 3 October 2008. DOI: is the director of a not-for-profit GI-based food endorsement program in Australia. is employed to manage the University of Sydney GI testing service. CONCLUSIONS The 2008 edi- 2008 by the American Diabetes Association. Readers may use this article as long as the work is properly tion of Tables of GI and GL has doubled cited, the use is educational and not for profit, and the work is not altered. See http://creativecommons. org/licenses/by-nc- for details. the amount of data available for research The costs of publication of this article were defrayed in part by the payment of page charges.
9 This article must therefore be hereby and other applications. Most varieties of le- marked advertisement in accordance with 18 Section 1734 solely to indicate this fact. gumes, pasta, fruits, and dairy products are DIABETES CARE, VOLUME 31, NUMBER 12, DECEMBER 2008 2281. Tables of Glycemic Index and load values still classified as low-GI foods (55 or less on 15 4. 65 4. 103 3. 61 3. 78 4. 87 3. 63 5. 39 4. 63 6. 64 7. 55 6. 53 2. 48 5. the glucose reference scale). Breads, break- fast cereals, rice, and snack products, in- cluding whole-grain versions, are available in both high- (70 or greater) and low-GI. forms. Most varieties of potato and rice are Plantain/green banana high GI, but lower GI cultivars were identi- Potato, instant mash Sweet potato, boiled Potato, french fries Pumpkin, boiled fied.
10 Many confectionary items, such as Vegetables Vegetable soup Carrots, boiled chocolate, have a low GI, but their high sat- Sugars Potato, boiled Taro, boiled urated fat content reduces their nutritional value. The GI should not be used in isola- Fructose Glucose Sucrose Honey tion; the energy density and macronutrient profile of foods should also be considered (1). The high correlation coefficient (r . ) between values derived from testing the same foods in normal and diabetic sub- 36 2. 43 3. 51 3. 59 8. 51 5. 76 4. 42 4. 43 5. 49 3. 41 2. 50 2. 40 3. 65 5. 56 3. 59 3. 87 2. jects indicates that GI values in table A1 are relevant to dietary interventions in people with diabetes.