Transcription of INTRODUCTION TO CANDLESTICK PATTERNS - ThinkMarkets
1 INTRODUCTION TO CANDLESTICK PATTERNS Learning to Read Basic CANDLESTICK PATTERNS Page 1 of 18 CANDLESTICKS TECHNICAL ANALYSIS Contents Risk Warning .. 2 What are Candlesticks? .. 3 Why do Candlesticks Work? .. 5 What are Candlesticks? .. 6 Doji .. 6 7 Hanging Man .. 8 Shooting Star .. 8 9 Evening Star .. 10 Morning Star .. 10 Bullish Engulfing .. 11 Bearish Engulfing .. 11 Harami/Inside Bar .. 12 Kicker .. 12 Piercing Line .. 13 Dark Cloud Cover .. 13 Three White Soldiers .. 14 Three Black Crows .. 14 Tweezer Pattern .. 15 Confluence .. 16 Doji at Support .. 16 Hammer, Dojis, and Bullish Checkmate at 200 Exponential Moving Average .. 17 Educate Your Trading .. 18 Page 2 of 18 CANDLESTICKS TECHNICAL ANALYSIS Risk Warning Risk Warning: Trading Forex and Derivatives carries a high level of risk. CFD investors do not own, or have any rights to, the underlying assets.
2 It involves the potential for profit as well as the risk of loss which may vastly exceed the amount of your initial investment and is not suitable for all investors. Please ensure that you fully understand the risks involved, and seek independent advice if necessary. Also, see the section titled Significant Risks in our Product Disclosure Statement, which also includes risks associated with the use of third parties and software plugins. A Financial Services Guide (FSG) and Product Disclosure Statements (PDS) for these products is available from TF GLOBAL MARKETS (AUST) PTY LTD by going to to download at this website or hard copies can be sent by contacting the offices at the number above. The FSG and PDS should be considered before deciding to enter into any Derivative transactions with TF GLOBAL MARKETS (AUST) PTY LTD. The information on this site is not directed at residents in any country or jurisdiction where such distribution or use would be contrary to local law or regulation.
3 2014 TF GLOBAL MARKETS (AUST) PTY LTD. All rights reserved. AFSL 424700. ABN 69 158 361 561. *Free: Items that are indicated as FREE are available without any terms and conditions, with the exception of any promotional offers that have terms and conditions attached. Page 3 of 18 CANDLESTICKS TECHNICAL ANALYSIS What are Candlesticks? Put simply, candlesticks are a way of communicating information about how price is moving. CANDLESTICK charts are available on ThinkForex trading platforms for all assets individuals can trade on the platforms. Below is a sample of a CANDLESTICK chart derived from the ThinkForex web trading platform: This chart shows price on the right (vertical) axis, and time on the bottom (horizontal) axis. Moreover, the chart is made of bars that have little lines stemming from the top and the bottom; these are known as candles.
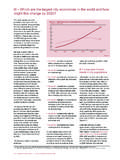
4 The candle conveys four pieces of information: 1. The open price 3. The high price 2. The close price 4. The low price Page 4 of 18 CANDLESTICKS TECHNICAL ANALYSIS Candles refer to that information for a specific unit of time. For instance, the chart above is a daily chart; each chart represents one day. And thus, each candle constitutes, the open, close, high, and low price for that given day. The horizontal axis at the bottom of the chart can be used to understand which day corresponds to which candle. Below is an image that illustrates how those four pieces of information the open, low, high, and close for a given period of time are visualized in the context of a candle: The wicks, or shadows, are the thin lines that go outside the rectangular body of the candle. They represent the high and the low price during that time period. The color of the candle is also significant in understanding whether the open price was higher or lower than the close price.
5 If the candle is red, or denoted as bearish in some other manner, this means that the open price is lower than the close; and the opposite is true if the candle is green, or denoted as bearish. Page 5 of 18 CANDLESTICKS TECHNICAL ANALYSIS Consider the candle above. The absolute highest point on the candle, the top of the upper line above therectangular body, is the high price; the absolute lowest point shows how far price fell during the time period in question. The top of the candle is the opening price of the time period, while the bottom of the candle is the closing price. Thus, from this candle, we see that price rallied and fell from its open but bears were ultimately able to push it lower than the open, while bulls came in before the close to push price up a bit. Why do Candlesticks Work? Price action traders rely on candlesticks because they convey a great deal of information about each trading period in a visual format that is easy to interpret, allowing traders to compare the behavior of price in different time periods with a quick glance at a price action chart.
6 Each CANDLESTICK can be read as a meaningful part of the developing narrative of price. They communicate the market sentiment : whether (and to what extent) bears or bulls were in control, and how far traders managed to push price in both directions. For example, a long candle s body with no wicks indicates a definitive shift in this struggle for power, whereas a candle with a long upper wick beyond its body indicates a more contentious period with an effort by bulls to push price higher that was pushed back by pressure from bears before the close of the candle. Certain re-occurring CANDLESTICK PATTERNS have become popular among traders as reliable signals of future market behavior. This guide is intended as an INTRODUCTION to some of these PATTERNS , which helptraders make sense of market conditions and recognize advantageous times to enter trades. The ability to read candlesticks allows the price action trader to become a meta-strategist, taking into account the behaviors of other traders and large-scale market-movers.
7 In other words, CANDLESTICK PATTERNS help traders. Page 6 of 18 CANDLESTICKS TECHNICAL ANALYSIS What are Candlesticks? Calibrate their own trading with the fluctuations and reversals of larger, more influential participants in market, often referred to as Smart Money , so that traders can identify and participate in significant price moves. The chart below demonstrates some of the innumerable PATTERNS formed by candlesticks in the context of a daily price action chart. These PATTERNS will be discussed and elaborated upon in the remainder of this guide. Doji This candle has zero or almost zero range between its open and close. Rather than implying potential reversal or the clear dominance of either bears or bulls, these candles suggest indecision or balance between the two forces. Neither buyers nor sellers are fully in control. A doji that occurs in the context of a strong trend implies the weakening of the dominant force that resulted in that trend.
8 A long-legged doji has long wicks in both directions, implying strong, balanced pressure from both buyers and sellers. Page 7 of 18 CANDLESTICKS TECHNICAL ANALYSIS The dragonfly and gravestone doji imply, respectively, that sellers and buyers controlled the market for most of the trading period, but then the opposite group managed to push price back to the open before the close. While tradition and long-legged dojis are reflective of indecision and stalling, gravestone and dragonfly are generally clearer, stronger indicators that a force is stepping in to push the market in the direction of the wick and away from the body. In this respect, gravestone and dragonfly dojis are similar to hammer and hanging man PATTERNS , which are discussed later in this guide. Hammer A hammer is a CANDLESTICK with a small body (a small range from open to close), a long wick protruding below the body, and little to no wick above.
9 In this respect it is very similar to a dragonfly doji; the primary difference is that a dragonfly doji will have essentially no body, meaning the open and close prices are equal. When a hammer appears at the bottom of a downtrend, its long wick implies an unsuccessful effort by bears to push price down, and a corresponding effort by bulls to step in and push price back up quickly before the period closed. As such, a hammer CANDLESTICK in the context of a downtrend suggests the potential exhaustion of the downtrend and the onset of a bullish reversal. The neckline, often determined by the high of the previous bar, is the level that price must hit on the next CANDLESTICK in order to confirm the hammer s reversal signal. Page 8 of 18 CANDLESTICKS TECHNICAL ANALYSIS Hanging Man The hanging man is the name given to a candle that is identical in shape to the hammer; the difference is that while hammers occur in downtrends, the hanging man pattern occurs in uptrends.
10 In this case, the wick extends down, contrary to the uptrend, and suggests the emergence of bearish demand capable of pushing the price down. It is often the first sign that the uptrend is exhausting, and bears are stepping in to create a reversal. For the reversal signal to be confirmed, the consequent bearish bar should reach the neckline established by the open of the bullish bar on the other side of the hanging man. Shooting Star This CANDLESTICK is simply the inversion of the hanging man: it has a small body and a long wick protruding above it, with little to no wick below. The shooting star occurs at the height of an uptrend; its long wick implies that resistance to further bullish movement has been encountered above the close, and a bearish reversal may be imminent. In this case, a strong black candle or a price at the level of the previous bar s open can act as confirmation or an entry point.