Transcription of Introduction to Cost Modeling, Template Overview for ...
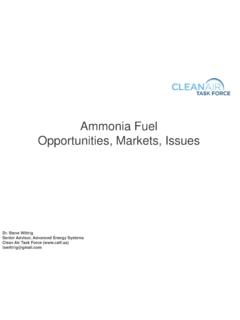
1 Introduction to Cost Modeling, Template Overview for Performers ARPA-E Tech-to-Market February 12, 2014. Outline Context for Cost Modeling Motivation, Definitions, and Examples Template Description Scope, Overview , Worksheet Details Final Remarks February 18, 2016 Cost Modeling 1. Part I. Context for Cost Modeling Motivation, Definitions, and Examples Template Description Scope, Overview , Worksheet Details Final Remarks February 18, 2016 Cost Modeling 2. Cost & Value Production cost (necessary but not sufficient by itself).
2 + Willingness to pay (customer value). Value creation potential of product WTP Consumer Value Surplus + Created Price Producer $. Surplus (Profit). Cost February 18, 2016 Cost Modeling 3. Economic Modeling for Technology Full Business Financial Model Cash flow, Production / Operation Cost Model dynamics of ramping production Determine resources and varying sales, (and $$) required for Basic Materials & Process investments timing at-scale production/operation Similar information Bill of Materials Simple block for other projects Tabulate (BOM)
3 List of diagram of competing for material/component ingredients production steps resources flow, labor & energy decision-making use, equipment, etc Most performers aim for basic form of Production Cost Model . February 18, 2016 Cost Modeling 4. Cost Modeling Enables Research &. Development Integrates calculations together for holistic consideration Identify cost drivers steer research Communicate results with stakeholders Internal: R&D, Management, Marketing External: Industry Advisors, Investors, Customers, Licensing Partners February 18, 2016 Cost Modeling 5.
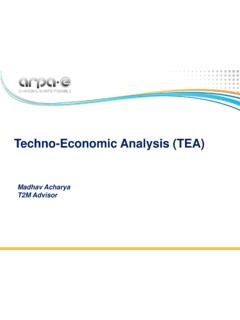
4 Modeling Benefits, Despite Uncertainty Possible concern: It's too early there is too much uncertainty to calculate exactly how profitable this company/product would be.. + WTP. $. Modeling still beneficial: Make uncertainties explicit Identify most valuable improvements Cost Develop targets, metrics Bound with theoretical limits Create thought framework for reducing uncertainties February 18, 2016 Cost Modeling 6. Example Techno-Economic Analysis Wave Energy Converters Reduce buoy cost by order of magnitude Cost ($/kWh).
5 Buoy contributes small portion of overall cost Opportunity Enhance wave sensing boost output, achieve competitive cost of electricity (Courtesy of Sea Engineering, Inc.). February 18, 2016 Cost Modeling 7. Outline Context for Cost Modeling Motivation, Definitions, and Examples Template Description Scope, Overview , Worksheet Details Final Remarks February 18, 2016 Cost Modeling 8. Template Scope MODEL INCLUDES. All major cost factors for production of saleable product Production model for bottom-up calculation of labor, material, and capital requirements to meet production volume Cost sensitivity and scaling analyses Estimated value of production project using sale price MODEL DOES NOT INCLUDE.
6 Operational details ( schedule of work shifts). Minute product details Growth dynamics of business, production, or sales Company financial model (debt, equity, taxes, etc.). February 18, 2016 Cost Modeling 9. Template Worksheets # Sheet Name Description 1 Process Diagram Hand-drawn block diagram 2 Results Summary Displays key model inputs, outputs, essential analysis Step-by-step calculations: materials, labor, and production Production Model &. 3 requirements (core of whole spreadsheet). OpEx 4 CapEx Building, equipment, tools, etc.
7 Product Performance metrics, tied to production model if possible, 5 supporting product value to customer Performance 6 Financial Fully loaded product cost, price, margin, payback period 7 Cost Analysis Sensitivity analysis, step-by-step breakdown , scaling 8 Mass & Energy Supporting calculations regarding materials and processes February 18, 2016 Cost Modeling 10. Sheet 1: Process Diagram Capture the entire production process in easily understood format Descriptive step names and step-wise material inputs and outputs Establish modeling level of detail: each step to receive its own treatment in production model Overall inputs and output define position in value chain February 18, 2016 Cost Modeling 11.
8 Sheet 2: Results Summary Provides a quick-look at key model inputs and outputs May choose to link inputs from this page to quickly run and show multiple scenarios February 18, 2016 Cost Modeling 12. Sheet 3: Production Model & OpEx (1/3). Builds up quantitative operating requirements for reaching desired production volume Calculate backwards: [production volume] [throughput of last step] . [throughput of second-to-last step] [throughput of first step]. Requires definition of: Process-Step Properties: Batch Size; Cycle Time; Usage of Labor, Materials, Utilities; Yield, etc.
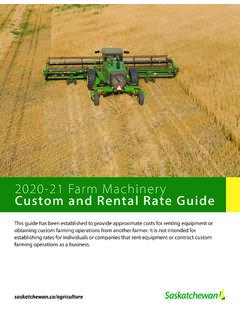
9 Operational Availability: Days per Year, etc. Tabulates consumption and production Materials/Components, Labor, Utilities, Product Calculates and implements required parallel production stations, step-wise Using cost rates, calculates all operating expenses February 18, 2016 Cost Modeling 13. Sheet 3: Production Model & OpEx (2/3). Batch definition grants flexibility Allows realistic, convenient units and conversion of units during steps Units must match between steps; convert units from input to output within a step For continuous process: maintain proportions, absolute values of materials and time can be arbitrarily small as needed February 18, 2016 Cost Modeling 14.
10 Sheet 3: Production Model & OpEx (3/3). (1) Step-wise 1 (Batch Input Quantity )i +1 . GPVi = GPVi +1 . Yi (Batch Output Quantity )i . Required Gross Production Volume batches per day (step i) batches per day Y: Yield batch size conversion factor (step i+1) ( 98%) (must be same units). (2) Parallel (Min Req' d Prod Lines)i = GPVi . 1. Production Operating Hours UtilMAX. Required . Operating Day . Hours maximum allowed batches per utilization ( 85%). day per line Batch i . (3) Labor Workers Operating Hours Required Direct Labor = # Lines Utilization Line Operating Day (person-hrs/day).