Transcription of Introduction to DNA Cell Cycle Analysis
1 Introduction TO. CELL Cycle Analysis . Written by Dr. Peter Rabinovitch, , Published by Phoenix Flow Systems, Inc. 6790 Top Gun St. #1. San Diego, CA. USA 92121. 858 453-5095. fax 858 453-2117. The Biological Cell Cycle ..2. DNA Analysis and the Flow Cytometric Cell Cycle ..3. Diploid and Aneuploid DNA Cell Cycle Analysis of DNA Content Fitting of Background Debris and Effects of Nucleus Sectioning ..9. Fitting and Correction for the Effects of Cellular or Nuclear Quantitation of Background, Aggregates And Analysis of Apoptosis ..31. Beyond Single Parameter Analysis : DNA vs. basics of DNA Cell Cycle Analysis Page 1. This chapter is organized into progressively more advanced sections. Feel free to skip ahead to the level appropriate for your background.
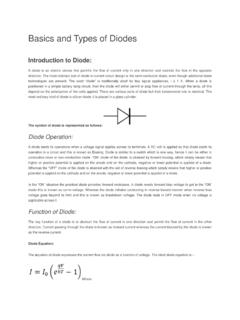
2 THE BIOLOGICAL CELL Cycle . Reproduction of cells requires cell division, with production of two daughter cells . The most obvious cellular structure that requires duplication and division into daughter cells is the cell nucleus - the repository of the cell's genetic material, DNA. With few exceptions each cell in an organism contains the same amount of DNA and the same complement of chromosomes. Thus, cells must duplicate their allotment of DNA prior to division so that each daughter will receive the same DNA content as the parent. The Cycle of increase in components (growth) and division, followed by growth and division of these daughter cells , etc., is called the cell Cycle . The two most obvious features of the cell Cycle are the synthesis and duplication of nuclear DNA before division, and the process of cellular division itself - mitosis.
3 These two components of the cell Cycle are usually indicated in shorthand as the S phase and mitosis or M . When the S phase and M phase of the cell Cycle were originally described, it was observed that there was a temporal delay or gap between mitosis and the onset of DNA synthesis, and another gap between the completion of DNA. synthesis and the onset of mitosis. These gaps were termed G1 and G2, respectively. The Cycle of G1 S G2 M G1, etc., is shown schematically in Figure Figure A schematic of the cell Cycle , showing flow cytometric components of each phase basics of DNA Cell Cycle Analysis Page 2. When not in the process of preparing for cell division, (most of the cells in our body are not), cells remain in the G1 portion of the cell Cycle .
4 The G1. phase is thus numerically the most predominant phase of the cell Cycle and shows up as the largest peak. A subset of G1 cells which are very quiescent and have little of the cellular functions needed to enter the cell Cycle are sometimes referred to as G0 cells . Some of the cellular processes, which take place in the G1 and G2 phases of the cell Cycle , are now known. The G1 phase is a synthetic growth phase for many RNA and protein molecules that will be needed for DNA synthesis and cell growth before division. The G2 phase is a time for repair of any DNA. damage which has occurred during the preceding cell Cycle phases, and for the reorganization of the DNA structure which must take place before the DNA can be divided equally between daughters during Mitosis.
5 The length of these phases may vary between different cell types that are actively in the process of cell division. Typical time spans in which the cell is engaged in each of the phases of the cell Cycle are 12 hours for G1, 6 hours for S phase, 4 hours for G2, and hour for Mitosis. DNA Analysis AND THE. FLOW CYTOMETRIC CELL Cycle . One of the earliest applications of flow cytometry was the measurement of DNA content in cells ; the first rapid identification of phases of the cell Cycle other than mitosis. This Analysis is based on the ability to stain the cellular DNA in a stoichiometric manner (the amount of stain is directly proportional to the amount of DNA within the cell). A variety of dyes are available to serve this function, all of which have high binding affinities for DNA.
6 The location to which these dyes bind on the DNA molecule varies with the type of dye used. The two most common categories of DNA binding dyes in use today are the blue-excited dye Propidium Iodide (PI) (or occasionally the related dye, Ethidium Bromide) and the UV-excited dyes diamidino-phenylindole (DAPI). and Hoechst dyes 33342 and 33258. PI is an intercalating dye which binds to DNA and double stranded RNA (and is thus almost always used in conjunction with RNAse to remove RNA), while DAPI and Hoechst dyes bind to the minor groove of the DNA helix and have essentially no binding to RNA. Hoechst 33342 has the distinction of being the only dye presently available which allows satisfactory DNA staining of viable cells .
7 The other dyes require permeabilization of the cell membrane before staining, most often by detergent or hypotonic treatment or by solvent ( ethanol) fixation. basics of DNA Cell Cycle Analysis Page 3. * Note: Fixation with solvents ( ethanol) often produces considerable aggregation of cells ; see subsequent section on Analysis of cell aggregation. Whichever DNA-binding fluorescent dye is used, a characteristic pattern is seen that reflects the cell Cycle phases that make up the mixed cell population. When diploid cells which have been stained with a dye that stochiometrically binds to DNA are analyzed by flow cytometry, a narrow . distribution of fluorescent intensities is obtained. This is displayed as a histogram of fluorescence intensity (X-axis) vs.
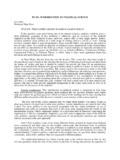
8 Number of cells with each observed intensity. Since all G1 cells have the same DNA content, exactly the same fluorescence should in theory be detected from every G1 cell, and only a single channel in our histogram would be filled ( there would be a very sharp spike in the histogram at the G1 fluorescence intensity, Figure ). Figure The difference between a histogram from a perfect . flow cytometer with no errors in measurement (A) and the Gaussian broadening of the histogram that is encountered in all real analyses (B). In B, actual data points are displayed as small diamonds, solid lines indicate the Gaussian G1 and G2 phase components and the S. phase distribution, as fit with the Dean and Jett polynomial S phase model.
9 The dashed line shows the overall fit of the model to the data. This would occur if the flow cytometer was perfect and if binding of the DNA-specific dye was perfectly uniform. In practice, however, there are a variety of sources of instrumental error in cytometers, in addition to some biological variability in DNA dye binding. Consequently, the measured fluorescence from G1 cells is a normally distributed Gaussian peak. This bell-shaped distribution is characteristic of such variation in measurement (Figure ). The greater the observational variation, the broader the resulting Gaussian peak. The term Coefficient of Variation (CV) is used to describe the width of the peak. CV is a normalized standard deviation defined as CV = 100 *.
10 Standard Deviation / Mean of peak. basics of DNA Cell Cycle Analysis Page 4. Similarly, G2 and mitotic cells , described as having twice the normal G1. DNA content, produce a Gaussian peak in the DNA content histogram with a mean position approximately twice that of the G1 peak (see Figure ). In fact, the G2/G1 ratio is usually less than , due to the fact that the DNA-protein (chromatin) packing is tighter or more condensed in G2 cells than in G1 cells . Consequently, the DNA binding dyes usually have slightly impaired accessibility to their DNA binding sites. A G2/G1 ratio of about is more common. In a theoretically perfect flow cytometer, S phase cells would be observed in the histogram starting just above the position occupied by all the G1 cells , and some of the S phase cells would be found in each channel extending up to just below the position of all the G2 cells .