Transcription of Introduction to Fermentation
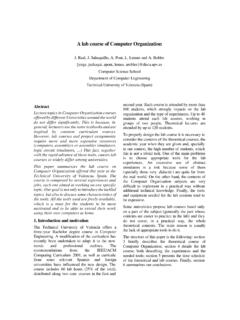
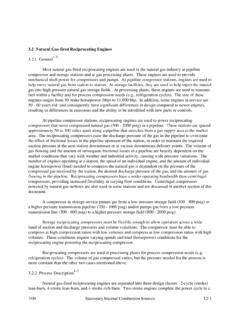
1 Introduction to FermentationIntroduction to FermentationGenetically modifiedGenetically modifiedEscherichia coliEscherichia colihave been chosen as the host have been chosen as the host organism for each of the coorganism for each of the co--proteins to be produced. Each strain of proteins to be produced. Each strain of contain a different gene that is responsible for producing will contain a different gene that is responsible for producing the desired cothe desired co--protein. The modified protein. The modified will be separately cells will be separately grown through the process of batch Fermentation . This tutorial wgrown through the process of batch Fermentation . This tutorial will ill introduce you to the following areas regarding batch fermentatiointroduce you to the following areas regarding batch Fermentation :n: Microbial Growth Phases Associated with Batch Microbial Growth Phases Associated with Batch FermentationFermentation Lag PhaseLag Phase Exponential PhaseExponential Phase Stationary PhaseStationary Phase Death PhaseDeath Phase The Stages of Batch FermentationThe Stages of Batch Fermentation Shake FlaskShake Flask Seed Seed FermentorFermentor Production Production FermentorFermentorMicrobial Growth in Batch FermentationMicrobial Growth in Batch FermentationAs the cells in a batch As the cells in a batch Fermentation grow, they Fermentation grow, they follow a growth curve follow a growth curve similar to the one shown similar to the one shown here.
2 The growth curve here. The growth curve contains four distinct contains four distinct regions known as regions known as phases. They are as phases. They are as follows:follows:1) Lag Phase1) Lag Phase2) Exponential Phase2) Exponential Phase3) Stationary Phase3) Stationary Phase4) Death Phase4) Death PhaseGrowth curve is from Shuler p. Growth in Batch FermentationMicrobial Growth in Batch FermentationLag PhaseLag Phase The first major phase of microbial growth in a batch fermentaThe first major phase of microbial growth in a batch fermentationtionprocessprocess A period of adaptation of the cells to their new environmentA period of adaptation of the cells to their new environment Minimal increase in cell densityMinimal increase in cell density May be absent in some fermentationsMay be absent in some fermentationsShuler p. 161 Shuler p. Growth in Batch FermentationMicrobial Growth in Batch FermentationExponential PhaseExponential Phase The second major phase of microbial growth in a batch fermentThe second major phase of microbial growth in a batch Fermentation ation processprocess Also known as the logarithmic growth phaseAlso known as the logarithmic growth phase Cells have adjusted to their new environmentCells have adjusted to their new environment The cells are dividing at a constant rate resulting in an expThe cells are dividing at a constant rate resulting in an exponential onential increase in the number of cells present.
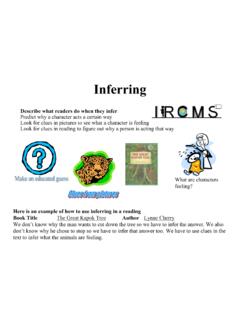
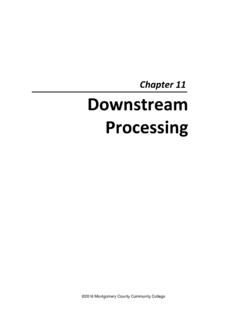
3 This is known as tincrease in the number of cells present. This is known as the specifiche specificgrowth rate and is represented mathematically by first ordergrowth rate and is represented mathematically by first orderkinetics kinetics as the following:as the following:dXdX= (= ( kkdd)X)Xddt t where X is the cell concentration, where X is the cell concentration, is the cell growth rate, and is the cell growth rate, and kkddis the cell death rate. The term is the cell death rate. The term kkddcan be referred to as can be referred to as netnet.. The cell death rate is sometimes neglected if it is consideThe cell death rate is sometimes neglected if it is considerably rably smaller than the cell growth than the cell growth p. 162 Shuler p. Growth in Batch FermentationMicrobial Growth in Batch FermentationExponential Phase (continued)Exponential Phase (continued) Cell growth rate is often substrate Cell growth rate is often substrate limited, as depicted in the figure tolimited, as depicted in the figure tothe right.
4 The growth curve is well The growth curve is well represented by represented by MonodMonodbatch batch kinetics, which is mathematicallykinetics, which is mathematicallydepicted on the following on the following , p. Growth in Batch FermentationMicrobial Growth in Batch FermentationExponential Phase (continued)Exponential Phase (continued) MonodMonodbatch kinetics is represented mathematically in the batch kinetics is represented mathematically in the following equation:following equation: = = maxmaxS S KKss+ S+ Swhere where is the specific growth rate, is the specific growth rate, max max is the maximum specific is the maximum specific growth rate, S is the growth limiting substrate concentratigrowth rate, S is the growth limiting substrate concentration, and on, and KKS S is the saturation constant which is equal to the substrate is the saturation constant which is equal to the substrate concentration that produces a specific growth rate equal toconcentration that produces a specific growth rate equal tohalf half the maximum specific growth rate.
5 All specific growth ratethe maximum specific growth rate. All specific growth rates s account for the term account for the term kkddand should be considered to be and should be considered to be p. p. Growth in Batch FermentationMicrobial Growth in Batch FermentationExponential Phase (continued)Exponential Phase (continued) There are other models used to determine cell growth rate thaThere are other models used to determine cell growth rate that t depend upon inhibitiondepend upon inhibition Substrate InhibitionSubstrate Inhibition Product InhibitionProduct Inhibition Toxic Compounds InhibitionToxic Compounds Inhibition The type of inhibition causes mathematical changes in the The type of inhibition causes mathematical changes in the previously presented previously presented MonodMonodequation for batch kineticsequation for batch kineticsShuler, p. 178 Shuler, p. Growth in Batch FermentationMicrobial Growth in Batch FermentationExponential Phase (continued)Exponential Phase (continued) Substrate InhibitionSubstrate Inhibition In batch Fermentation , this can occur during the initial grIn batch Fermentation , this can occur during the initial growth owth phases while substrate concentrations are highphases while substrate concentrations are high If this is a major problem, continuous or fedIf this is a major problem, continuous or fed--batch batch Fermentation methods should be consideredfermentation methods should be considered Product InhibitionProduct Inhibition In batch Fermentation , this can occur after induction of thIn batch Fermentation , this can occur after induction of the e recombinant generecombinant geneShuler, p.
6 178 Shuler, p. Growth in Batch FermentationMicrobial Growth in Batch FermentationStationary PhaseStationary Phase The third major phase of microbial growth in a batch fermentaThe third major phase of microbial growth in a batch Fermentation tion processprocess Occurs when the number of cells dividing and dying is in Occurs when the number of cells dividing and dying is in equilibrium and can be the result of the following:equilibrium and can be the result of the following: Depletion of one or more essential growth nutrientsDepletion of one or more essential growth nutrients Accumulation of toxic growth associated byAccumulation of toxic growth associated by--productsproducts Stress associated with the induction of a recombinant geneStress associated with the induction of a recombinant gene Primary metabolite, or growth associated, production stopsPrimary metabolite, or growth associated, production stops Secondary metabolite, or nonSecondary metabolite, or non--growth associated, production may growth associated, production may continuecontinueShuler p.
7 163 Shuler p. Growth in Batch FermentationMicrobial Growth in Batch FermentationDeath PhaseDeath Phase The fourth major phase of microbial growth in a batch The fourth major phase of microbial growth in a batch Fermentation processfermentation process Also known as the decline phaseAlso known as the decline phase The rate of cells dying is greater than the rate of cells divThe rate of cells dying is greater than the rate of cells dividingiding Similar to Exponential phase, it is represented mathematicallSimilar to Exponential phase, it is represented mathematically by y by first order kinetics as the following:first order kinetics as the following:dXdX= = --kkddXXddt t Shuler p. 164 Shuler p. Growth in Batch FermentationMicrobial Growth in Batch FermentationThere are a two main methods primarily used to establish a growtThere are a two main methods primarily used to establish a growth h curve. Both of which are represented on the previously shown curve.
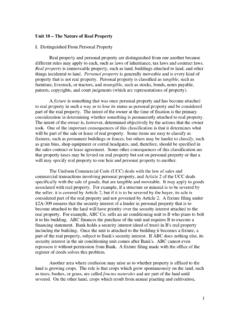
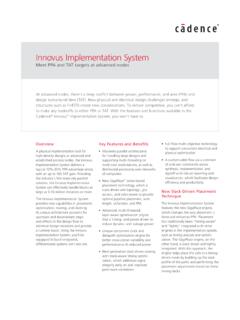
8 Both of which are represented on the previously shown growth curve. Viable Cell Count Viable Cell Count Initially lower curve representing the number of cells that aInitially lower curve representing the number of cells that are re actually viableactually viable Determined by plating a sample from the cultureDetermined by plating a sample from the culture Optical DensityOptical Density Initially higher curve representing the number of cells that Initially higher curve representing the number of cells that are both viable and nonare both viable and non--viableviable Determined by taking an optical measurement using a Determined by taking an optical measurement using a spectrophotometerspectrophotometerShuler , p. , p. Growth in Batch FermentationMicrobial Growth in Batch FermentationMeasuring the optical density with a Measuring the optical density with a spectrophotometer is a quick and spectrophotometer is a quick and easy way to to develop a growth easy way to to develop a growth curve.
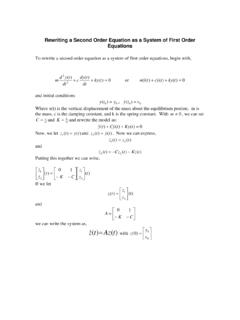
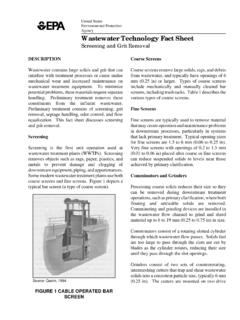
9 One takes a sample of the curve. One takes a sample of the Fermentation broth and measures the Fermentation broth and measures the absorbance at a particular absorbance at a particular wavelength in the wavelength in the spectrophotometer. For spectrophotometer. For cells in a typically LB medium, the in a typically LB medium, the wavelength used in 600 nm. The wavelength used in 600 nm. The measured value can be compared to measured value can be compared to previous measurements made in previous measurements made in conjunction with cell plating or cell conjunction with cell plating or cell counting. The negative side of using counting. The negative side of using the optical density is that both viable the optical density is that both viable and nonand non--viable cells absorb this viable cells absorb this wavelength. As a result, the values wavelength. As a result, the values taken are not representative of only taken are not representative of only viable pictured above isa copyright of PerkinElmerviable FermentationBatch FermentationNow that you understand how microbial cells grow in a batch Now that you understand how microbial cells grow in a batch process, it is time to see how a general biotechnology fermentatprocess, it is time to see how a general biotechnology Fermentation ion process works.
10 Process works. An example, of a Fermentation process is An example, of a Fermentation process is represented in the block flow diagram shown below. The differenrepresented in the block flow diagram shown below. The different t blocks depicted are described in detail in the following depicted are described in detail in the following Flask1stSeedFermentor2ndSeedFermentorPro ductionFermentorMedia PrepPurificationBatch FermentationBatch FermentationFirst, a frozen vial containing a few First, a frozen vial containing a few milliliters of one recombinant milliliters of one recombinant is taken out of a freezer and strain is taken out of a freezer and thawed. This vial is sometimes referred thawed. This vial is sometimes referred to as an to as an inoculuminoculumvial and itsvial and its contents contents is known as an is known as an thawing, the After thawing, the inoculuminoculumis is transferred in a sterile manner to a transferred in a sterile manner to a shake flask containing growth media.