Transcription of Introduction to GIS - MIT OpenCourseWare
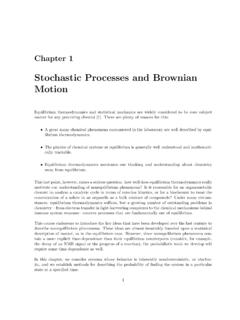
1 Introduction to GIS 1 Overview What is GIS? Types of Data and Projections What can I do with GIS? Data Sources and Formats Software Data Management Tips 2 What is GIS? 3 Characteristics of GIS The data Spatial Tabular Methods Data input Data management Data analysis: answer questions that may not be explicitly stated in the data Data output: maps, new data Software and hardware 4 Characteristics of GIS: Data Layers With GIS software, you can digitally represent geographic objects with a variety of shapes and layer those shapes on top of one another to create maps and perform analysis. Polygons 5 With GIS software, you can digitally represent geographic objects with a variety of shapes and layer those shapes on top of one another to create maps and perform analysis. Polygons Lines Characteristics of GIS: Data Layers 6 With GIS software, you can digitally represent geographic objects with a variety of shapes and layer those shapes on top of one another to create maps and perform analysis.
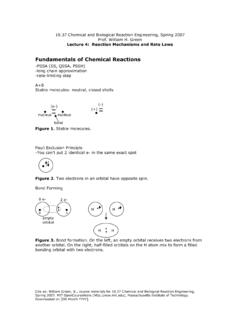
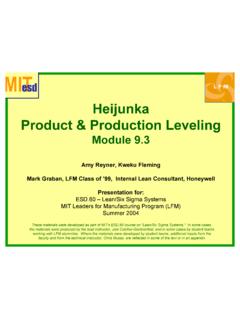
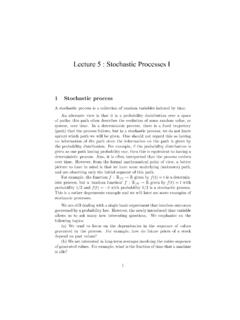
2 Polygons Lines Points Characteristics of GIS: Data Layers 7 With GIS software, you can digitally represent geographic objects with a variety of shapes and layer those shapes on top of one another to create maps and perform analysis. Polygons Lines Points Raster images (pixels) Characteristics of GIS: Data Layers 8 Data Types: Spatial Spatial or coordinate data represent features that have a known location on the earth. Vector: Points, lines, and polygons Raster: Row and column matrix 9 Image by MIT Types: Vector Polygon and Points Lines 10 Data Types: Raster A model of the world as a surface that is divided into a regular grid of cells, arranged into rows and columns. All cells (or pixels) must be the same size. All cells have a value. Image from: #//009t0000000200000011 RastRaster ImageImage by MIT Types: Raster Rasters include images, elevation models, and scanned maps.
3 12 Data Attribute Table Spatial data have a backend database called an attribute table. It can be used for querying and analysis. All attributes can be mapped. 13 Data Attribute Table Each state is represented with a different color. 14 Data Attribute Table Each state is color coded based on its population. 15 Data Types: Tabular Table (CSV, Excel) or database (Access, Oracle, PostgreSQL) Can be transformed into spatial data and mapped: Join with spatial data files by a common attribute (state name, unique ID, etc.) Map as points using coordinates such as longitude and latitude gathered from a GPS device Geocode: associate address fields with a street network 16 Map Projections There are many different map projections. All map projections distort at least some of the following: Shape Area Distance Direction 17 What can I do with GIS? 18 VIEW DATA AND CREATE MAPS 19 View Imagery City of Cambridge Aerial Photograph, April 2010 20 Create 3D models 21 Create Maps 22 Create Maps 23 Create Maps Image in the public domain.
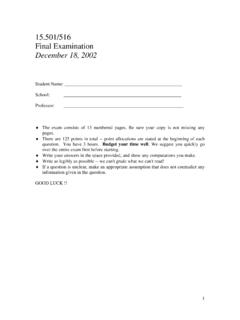
4 From: ANALYSIS 25 Create Buffers Calculate what is Inside Outside Within a certain distance Buffers in -mile increments around Fenway Park 26 Clip Features Now only the water in Massachusetts is visible. All the water bodies in the US have been clipped using the Massachusetts state boundary. 27 Network Analysis 28 Spatial Statistics Courtesy of Tilden76 on Wikipedia at / License CC BY Raster Data Digital Elevation Model (DEM): A sampled array of elevations for a number of ground positions at regularly spaced intervals Use it to: Calculate rivers and watersheds, Create contour lines Determine viewsheds More! Calculate area and volume Join data based on a common attribute (ID, name, etc.) or its spatial location Find where data layers intersect Find the nearest features Perform surface analysis Contour Slope Hillshade Viewshed Hydrology 31 Where do I find GIS data?
5 32 Data Sources MIT sources GeoWeb: use any web browser (includes data downloads as well as DVDs and Maps in the library) Internet (Links to data sources) Create your own GPS, digitizing, etc. Not finding what you want? GIS data purchase requests? Contact GIS Help. 33 GeoWeb search 2000+ layers of MIT hosted GIS data and data from other Services links to data: Open data! Anyone can contribute and download. 36 Data Formats ArcGIS can read many formats, including: Shapefile, personal geodatabase (Access), file geodatabase (ESRI) Image formats (JPG, TIF, GEOTIF, etc.) CAD (DXF and DWG) KML/KMZ files (from Google Earth) Data can be exported from ArcGIS to a variety of formats, including: KML CAD Adobe Illustrator TIF JPG 37 Create your own Data: Map coordinates or Addresses Geocode Addresses: 77 Massachusetts Ave. Cambridge, MA 02139 Add XY data: W N 38 Create your own Data: Georeference maps and images 39 Collect Your Own Data Global positioning system (GPS) devices are available for checkout from the Rotch Library circulation desk.
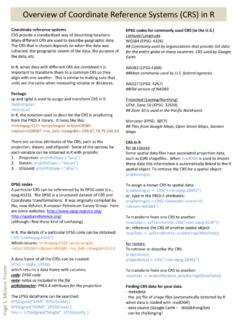
6 40 Courtesy of Nachoman-au on Wikipedia at #/media/ License CC BY Data Sources Data from different sources, covering the same area, can look very different. Evaluate scale, accuracy, and file size when selecting data for a project. The yellow line is the coastline from the US Census state boundary file. Blue is the coastline from MassGIS. 41 Metadata Information about the data layer Read the metadata to determine who created the data, when it was created, what the codes in the table mean, if there are constraints on how it can be used, etc. You can find metadata: Downloaded with your data layers On the website where you got your data Sometimes you may need to contact the data provider to get metadata Metadata is most commonly in html/xml format, text files, or in a table format, such as excel or csv. 42 Metadata 43 Metadata 44 What software can I use? 45 ESRI ArcGIS: ArcMap Provides the most tools for processing data, analysis, and creating maps Comprehensive support through our academic license 46 ArcToolbox 47 ESRI ArcGIS: ArcCatalog Manage files and folders Create new shapefiles and geodatabases Preview files View metadata in format of choice Create metadata so your data can be understood and shared with others Save metadata files as XML, TXT, HTML, or SGML 48 Open Source Software The source code is made available under a license that allows the modification and redistribution of the software at will.
7 For a more in-depth definition, visit the Open Source Initiative: 49 QGIS 50 Data Management Tips 51 Data Management Tips GIS projects tend to generate many files, which are generally large in size. For file naming: Use file names that represent the file (default names like Export_Output are not helpful if you need to come back to your project later). Some software programs and tools may have file name constraints ( an eight character limit without spaces). Watch out for this with ESRI ArcToolbox. Backup Your Data! 52 Data Management Tips Keep detailed notes about: Data sources Licensing constraints Data processing steps (ModelBuilder creates visuals of your procedure) What is stored where The GIS project maintains links to the individual data files (the data is not embedded in the map document itself) GIS formats, like shapefile (SHP), have many files that are linked together and must stay together in order to function Descriptions of the files you create and use (ArcCatalog has built-in tools for creating and editing metadata) 53 Exercise Overview Navigating the software interface Finding and adding data, including basemaps Accessing attribute information Symbolizing your data layers Selecting data by attribute and spatial location Creating new GIS data Designing a simple map 54 MIT geographic Information system (GIS)
8 TutorialJanuary IAP 2016 For information about citing these materials or our Terms of Use, visit.