Transcription of Introduction to Multiple Regression - biddle.com
1 Chapter 4 Chapter 4 Introduction to Multiple Regression Now that we have added a new tool to our statistical tool box, let s take a moment to review what we have. 1. The Correlation Coefficient: A single summary number that tells you whether a relationship exists between two variables, how strong that relationship is and whether the relationship is positive or negative. 2. The Coefficient of Determination: A single summary number that tells you how much variation in one variable is directly related to variation in another variable. 3. Linear Regression : A process that allows you to make predictions about variable Y based on knowledge you have about variable X . 4. The Standard Error of Estimate: A single summary number that allows you to tell how accurate your predictions are likely to be when you perform Linear Regression . I want to spend just a little more time dealing with correlation and Regression .
2 This chapter is only going to provide you with an Introduction to what is called Multiple Regression . Multiple Regression is a very advanced statistical too and it is extremely powerful when you are trying to develop a model for predicting a wide variety of outcomes. We are not going to go too far into Multiple Regression , it will only be a solid Introduction . If you go to graduate school you will probably have the opportunity to become much more acquainted with this powerful technique. Quick Review You use correlation analysis to find out if there is a statistically significant relationship between TWO variables. You use linear Regression analysis to make predictions based on the relationship that exists between two variables. The main limitation that you have with correlation and linear Regression as you have just learned how to do it is that it only works when you have TWO variables.
3 The problem is that most things are way too complicated to model them with just two variables. For example, suppose I asked you the following question, Why does a person receive the compensation that they do? What would you say? You might say something like the following: 1 Excerpted from The Radical Statistician by Jim Higgins, Copyright 2005 Used with permission of Author The Radical Statistician It could have something to do with how long a person has worked for the company. It could have something to do with how much experience a person has doing their specific kind of work. It could have something to do with their age (Age is a proxy for experience). It could have something to do with the type of work they do. It could have something to do with their performance ratings. It could have something to do with what part of the country they live in. You probably get the idea.
4 How much a person gets paid is really based on more than just a single piece of information. In reality, all of the above factors (and more besides) are likely to play some role in why a person gets paid what they do. If you were going to use standard correlation to study why people receive the compensation they do, you would be limited to only looking at one of these things at a time. For example, you could use correlation to study the relationship between a person s current compensation and their time with the company (as we did in the chapter on linear Regression ). You could also use correlation to study the relationship between a person s current compensation and how many years of school they completed. However, you could not do both to find out how a person s current compensation is related to both their education and how long they have worked for the company. Remember, Pearson s correlation is a bi-variate tool meaning that it is designed to find relationships between only two variables.
5 And yet, we know that life is so complicated that it takes way more than two variables to even begin to explain/predict why things are the way they are. What you need is a new tool Multiple Regression . Multiple Regression (R) A statistical tool that allows you to examine how Multiple independent variables are related to a dependent variable. Once you have identified how these Multiple variables relate to your dependent variable, you can take information about all of the independent variables and use it to make much more powerful and accurate predictions about why things are the way they are. This latter process is called Multiple Regression . Let s take a look at a couple of examples that will hopefully make this concept a bit easier for you to grasp. I am going to use Venn Diagrams similar to what we used to try and get a handle on what the Coefficient of Determination means.
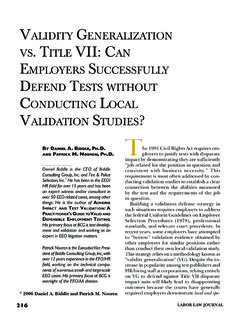
6 Figure 4-1 presents a picture of how two variables are related to each other. Figure 4-2 presents a picture of how two independent variables are related to a dependent variable while the two independent variables are NOT related to each other. 2 Excerpted from The Radical Statistician by Jim Higgins, Copyright 2005 Used with permission of Author Chapter 4 Figure 4-3 presents a picture of how two independent variables are related to a dependent variable while the two independent variables ARE related to each other. You must understand these three figures in order to understand the concepts of Multiple correlation and Multiple Regression . FIGURE 4-1 Example of the Relationship between Age and Current Compensation Age Current compensation Variation in compensation that has nothing to do with a person s age. Variation in age that has nothing to do with compensation In this example, 27% of what there is to know about a person s current compensation is accounted for by that person s age.
7 In other words, if you know a person s age, you know about 27% of what you need to know to make an accurate prediction about what their compensation is. The variance accounted for by the relationship between age and compensation (27%) 3 point is that the correlation between age and compensation tells us that a person s There is nothing new in Figure 4-1. This is simply a re-statement of what you already read about in the chapter on correlation. If you are unclear about what Figure 4-1 means, please return to that chapter and review the coefficient of determination . The main Excerpted from The Radical Statistician by Jim Higgins, Copyright 2005 Used with permission of Author The Radical Statistician 4 e one IGURE 4-2 e Relationship between Age (for those over 18 years of age) Time with designed to do. By having more than one predictor variable (age and time with compensation seems to change as a person ages.)
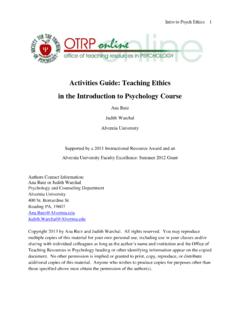
8 This makes intuitive sense becauswould expect that as a person ages, he or she works their way up at their job and gets paidmore. FExample of thCompany and Compensation Figure 4-2 is a good illustration about what Multiple correlation and Regression is Age Comp. Time with Company 27% of why a person earns what they do is related to the person s age. 10% of why a person earns what they do is related to their Time With Company. Important Point! Notice that a person s time with company accounts for about 10% of why they earn what they do. By adding this variable to our study, we improved our understanding of why people earn the income they do from 27% to 37%. In other words, using two variables rather than one variable, we improved our ability to make accurate predictions about a person s salary. Excerpted from The Radical Statistician by Jim Higgins, Copyright 2005 Used with permission of Author Chapter 4 5 com we s xample of the Relationship between Age (for those over 18 years of age), College mpensation pany), we are able account for more of the variance in compensation.
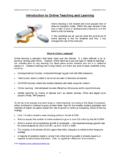
9 As a result,can make much more accurate predictions. This is because the second variable addadditional important information about your dependent variable (compensation). FIGURE 4-3 EDegree and Co Age Comp. 12% of why a person earns what they do is related to the person s age but is unrelated to a person s college degree. Important Point! Notice that this is much more complicated! 12% of a person s compensation is related to age, 45% is related to a person s college degree and 20% is related to an interaction between age and college degree. In this case we have pumped up our ability to predict/explain compensation to nearly 77%! College Degree 45% of why a person earns what they do is related to college degree but is unrelated to age. 11% of the variation shared by college degree and age is unrelated to income.
10 20% of income is related to an interaction of age and college degree. Excerpted from The Radical Statistician by Jim Higgins, Copyright 2005 Used with permission of Author The Radical Statistician 6 Hopefully, after looking at Figures 4-1, 4-2 and 4-3 you understand the following facts: When you have more than one independent variable you may very well be able to make more accurate predictions about your dependent variable. Think of it like trying to buy a car. If you only ask one of your friends what kind of car they think is best, you will get some information but it will be limited. you ask ten of your friends the same question, you will get more information and are probably more likely to identify a good car. The same thing is true with Regression research. If you are trying to develop a way to predict whether a seriously depressed person is likely to commit suicide, your prediction will be much more accurate if you take Multiple sources of information (independent variables) into account like age, medical history, history of prior attempts at suicide, score on a clinical depression survey, number of friends/family in the person s support network.