Transcription of Investment Detail Report - Morningstar
1 Using the Investment Detail Report with ClientsVersion document explains the different sections of the Investment Detail Report (IDR). In this document, we will review the IDR for a mutual fund . The IDR shows you detailed information on a portfolio s holdings and performance. The variety of graphs and statistics can provide numerous talking points on how a portfolio s diversification (or lack thereof) is likely to affect its information does the Investment Detail Report show?The Investment Detail Report has the following sections: Header information Growth of $10,000 Performance Portfolio Analysis Fees and Expenses Risk and Return Profile, and Operations. Each of these is discussed in Detail is the best way to use this Report with clients?This Report gives detailed information on a specific Investment . It can be used to show why you are recommending (or discouraging) putting money into a particular fund .
2 You can also use this Report to illustrate the fees and risks associated with a fund . Also, note that you can generate up to 25 IDRs at a time; you are not limited to creating them one at a informationVersion informationThe header information for an IDR (at the top of the first page) shows you the following: Release date of the Report Overall Morningstar RatingTM The name of the fund s category, and the number of funds in the category The fund s inception date Type of Investment , and Total assets for the fund (in millions of dollars).Here are some questions to consider when reviewing this information: What is the overall Morningstar Rating for the fund ? Is this a one- or two-star fund , or a four- or five-star fund ? What does the inception date tell us about the fund s age? Is this a brand-new fund without much of a track record, or has the fund been around for years or even decades?
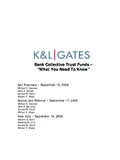
3 Does the size of the fund make you think that it could be suffering (or will soon suffer) from asset bloat, or is the size of the fund still reasonable?Growth of $10,000 Version of $10,000 Above the Growth of $10,000 graph, you can see the Morningstar Equity Style box for the fund at the end of each of the past 15 years (or to the inception date of a fund , if it lacks 15 years of history), and its year-to-date Equity Style box. Underneath each Equity Style box is a number, representing the percentage the fund was invested in growth of $10,000 graph includes the fund s performance as well as the category s average, and a benchmark index. At a glance, you can see whether a fund s value has increased, decreased or remained flat over History section below the Growth of $10,000 graph shows you the following: Performance quartile (within its category) NAV Total Return % Total Return +/- the benchmark index % Rank in its category, and The number of funds in the category)All of this information is as of the end of the calendar year.
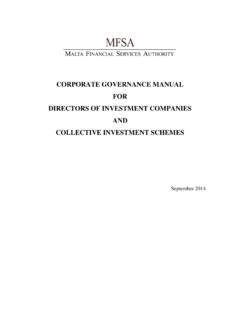
4 In the above screen shot, note that this fund was in the top quartile (top 25%) of its category for each year from 2000-2006, but through the first nine months of 2007, the fund is in the bottom quartile of its category. Here are some questions to consider when reviewing this information: In the Equity Style box area above the Growth of $10,000 graph, does the fund seem to drift from one area of the Style Box to another, or is it consistently in the same area year after year? Does drift, if present, reflect a change in strategy, performance chasing, or a new manager? Has the fund outperformed both it s category average and the index it is compared to? Has the NAV of the fund grown steadily over time? How did the fund perform during a particular period, such as the bear market of 2000-2002?Note the fund s performance within its category s quartiles Performance section (in the upper left corner) of the IDR shows you the following: quarterly returns for the past three calendar years Standardized trailing monthly, quarterly and total returns for the past 1-, 3-, 5- and 10-year periods whether the fund trailed or beat an index, and the fund s category rank for these trailing the following about this section: The date for the Performance figures on the Report could differ from the dates of the Portfolio Analysis section.
5 The Standardized trailing returns do not account for sales charges or taxation. The indices being used are those selected by Workstation, and are not necessarily the benchmark index selected by the fund family in its prospectus. It is not possible to customize this Report to use the benchmark index mentioned in a prospectus. Here are some questions to consider when reviewing this information: Does the fund perform consistently quarter-over-quarter, or does it fluctuate wildly from one extreme to another? Under the Trailing Returns area, does the fund have a good long-term track record? That is, is it in the top 30% of its category (or better) for the five- and ten-year periods?Note that this section is divided into two areas. The top is for just the pastthree calendar years, while the bottom shows trailing returns AnalysisVersion AnalysisThis section gives a detailed breakdown of the fund s holdings.
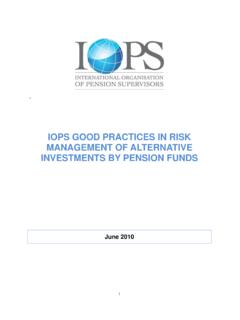
6 You can see the following here: An asset allocation pie chart The Morningstar Equity Style Box and Fixed Income Style Box Top 15 holdings, and their weighting in the portfolio Sector weightings Credit ratings for fixed-income items, and Regional are some questions to consider when reviewing this information: Does the fund have an asset allocation you would expect? For instance, does the fund invest almost entirely in stocks or bonds, or is it holding a large cash position? How much of the fund s assets are weighted among the top 15 holdings? Is the fund diversified across stock sectors, without making too large of a bet in any one area? What is the credit rating of the bonds in the fund s portfolio? Does the manager tend to invest in high quality bonds, or junk bonds? Is the client comfortable with the fund s international allocation?Fees and ExpensesThis section contains key information on front-end loads and deferred charges, as well as a fund s expense much of the portfolio s assets are weighted to just these top 15 holdings?
7 The composition section provides the Long, Shortand Net percentages. This is a true no-load and ExpensesVersion are some questions to consider when reviewing this information: Does the fund have a front load or a deferred load to consider? How long will the client likely hold this Investment ? Does the fund charge a 12b-1 Expense fee, or not? How do the expense fees for the fund compare to other investments in its Morningstar Category?Risk and Return ProfileVersion and Return ProfileThis Risk and Return Profile section has four sub-sections: Morningstar information Standard risk and return metrics Modern Portfolio Theory statistics, and Bond and tax Morningstar information shows the 3-, 5- and 10-year Morningstar Rating, Morningstar Risk and Morningstar Return scores for the fund , where applicable based on the inception date for a fund . Note that these three ratings work together to produce the overall Morningstar Rating.
8 The standard risk and return metrics show you the Standard Deviation, Mean and Sharpe Ratio for the fund over the trailing 3-, 5- and 10-year Modern Portfolio Theory statistics give you the Alpha, Beta and R-squared scores for the fund , compared to both a standard and best-fit bond and tax information includes the 12-month yield for the fund , the 30-day SEC yield (for comparison purposes), and the Potential Capital Gains Exposure for fund are some questions to consider when reviewing this information: Does the fund have a consistently high Morningstar rating? Or, does it have a strong 3-Yr Star Rating, but a weak 5- and 10-Year Star Rating? What accounts for this? Was there a manager change, or a shift in strategy, or did the fund s asset allocation recently come into favor? What is the fund s Morningstar Risk? Is this consistent with what you would expect from this asset class?
9 Is the R-Squared for the fund at least 80? If so, does it have a positive Alpha and a Beta close to or lower?)If the R-Squared score is not at least 80, the correlation of the fund to the index is considered weak, and the Alpha and Beta are not statisticsStandard risk and return metricsModern Portfolio Theory statisticsBond and tax informationOperationsVersion section contains basic information about the organization and people who run the fund . Of particular interest is the tenure of the fund manager, and whether the fund s stated objective here coincides with its actual style box designation and Morningstar code in the Purchase Constraints field indicates who may invest in the fund . See the Disclosure pages for information on how to interpret these are some questions to consider when reviewing this information: How long has the manager been at the fund ? How is the manager s presence reflected in the fund s performance, Style Box designation or equity allocation figures at the top of the Report ?
10 For instance, if a manager has four years of tenure, does the fund exhibit any style drift after he came on board? What is the fund s Objective? Can your client afford the minimum Investment requirements? Would any Purchase Constraints preclude your client from owning the fund ?Note the longevity of this manager s tenure at the fund .