Transcription of Investor BulletIn How to read A Mutual Fund shareholder …
1 Investor Assistance (800) 732-0330 BulletIn How to read A Mutual fund shareholder reportThe SEC s Office of Investor Education and Advocacy is issuing this Investor BulletIn to educate individual investors about Mutual fund shareholder and Semiannual ReportsMutual funds that are registered with the seC must send reports to their shareholders on a semiannual basis. the semiannual report covers the first six months of the fund s fiscal year, while the annual report covers the fund s entire fiscal year. Mutual funds that are registered with the seC prepare their own shareholder reports and file them with the seC. so long as these funds disclose the information that the seC requires in the shareholder report, they can decide how to organize and present the information within the Investor BulletIn focuses primarily on the annual report; however, many of the considerations also apply to the semiannual report. think of these shareholder reports as a report card on the fund s progress.
2 Reading these reports can help you determine how well a fund has met its goals and investment strategies during the period covered in the Information Can I Find in a shareholder Report?the table below identifies select information required to be disclosed in: (1) both the annual and semiannual report; and (2) the annual report and Semiannual Reportexpense example showing the cost in dollars for a hypothetical $1,000 investment over the period covered by the representation of holdings table, chart, or graph of holdings by category ( , type of security, industry sector, geographic region, credit quality, or maturity).Financial statements: Annual report audited financial statements, including a complete or summary (top 50) list of holdings. semiannual report financial statements need not be financial information (or financial highlights).remuneration or compensation paid to directors, officers, and regarding basis for approval of investment advisory contract discussion of the reasons the board approved any investment advisory contract during the period covered by the continued on next pageInvestor Assistance (800) 732-0330 n Continued from previous pageAnnual Report OnlyPerformance information: Management s discussion of fund performance; line graph comparing the performance during the last 10 years (or for the life of the fund , if shorter) of a hypothetical $10,000 initial investment against an index.
3 And table showing the fund s returns for 1-, 5-, and 10-year (or for the life of the fund , if shorter) : Although performance information is required for the annual report only, many funds include performance information in their semiannual report as information about directors and officers, including their names, ages, length of time at fund , principal occupations over the past 5 years, and of additional information about fund directors: statement explaining that more information about fund directors is available in the statement of Additional Information or online or by calling a toll-free telephone generally read the shareholder report to determine how well a fund has met its goals and investment strategies during the past six-month period (semiannual report) or the past fiscal year (annual report). Following are descriptions of several items in a shareholder report. the order of the items listed may vary from one report to InformationAs shown in the table above, the performance information typically consists of three components: (1) management s discussion of fund performance; (2) a line graph comparing the performance during the last 10 years (or for the life of the fund , if shorter) of a hypothetical $10,000 initial investment against an index; and (3) a table showing the fund s returns for 1-, 5-, and 10-year (or for the life of the fund , if shorter) s Discussion of fund Performance.
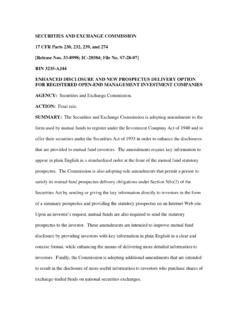
4 You will find fund management s discussion near the front of the annual report. this is management s opportunity to discuss the fund s performance during the fiscal year in light of market conditions and other factors that may have influenced the fund s investment return for the year. In that discussion, management usually will point out which holdings of the fund contributed significantly to the fund s performance and which holdings detracted significantly from that graph. Also near the front of the annual report is a line graph comparing the performance during the last 10 years (or for the life of the fund , if shorter) of a hypothetical $10,000 initial investment in the fund against an index. the line graph will be some variation of the generic line graph pictured below: Investor Assistance (800) 732-0330 the graph will show the progress of at least two lines over a ten-year period. one line will represent the growth or decline in value of a hypothetical $10,000 initial investment in the fund during the last 10 years (or for the life of the fund , if shorter).
5 Another line will represent the performance of an appropriate broad-based securities market index (for example, the s&P 500 index) during the last 10 years (showing the growth or decline in value of the hypothetical $10,000 had it been invested in a fund corresponding to that index). there may be additional lines representing other indexes, including those more narrowly-based that reflect the market sectors in which the fund invests or a non-securities index such as the Consumer Price Index, so long as the comparison is not quick glance at the graph will tell you whether the fund s performance has been steady or volatile over the 10-year period (or over the life of the fund , if shorter). For example, if the slope of the line is gradual, with occasional ups and downs, it suggests that fund performance has been relatively stable. If, on the other hand, the slope of the line is choppy, with numerous peaks and valleys, it suggests that the fund has been volatile and has experienced frequent variations in performance.
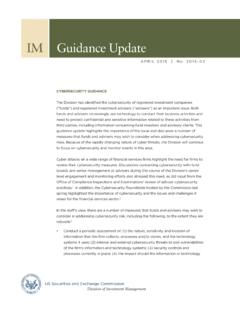
6 Compare the slope of that line with the line representing the index to which the fund is being compared. How closely does the fund s performance track that of the index? Investor Assistance (800) 732-0330 Performance Table. underneath the line graph is a table showing the fund s annualized (or average annual) returns for 1-, 5-, and 10-year (or for the life of the fund , if shorter) periods. Below is an example of this type of table:Average Annual Total ReturnsPeriods Ended December 31, 20 XXone YearFive Yearsten Years Final value of a $10,000 investmentXYZ $14,575 ,616 Pay close attention to the fund s 5- and 10-year returns. If the fund s returns were stellar in the past year but unimpressive in the past five or 10 years (or over the life of the fund , if shorter), it is possible that the past year soutperformance will not last. on the other hand, if the fund experienced steady returns in the past five or 10 years, but suffered a sharp loss in the past year, it may be unclear as to whether the recent loss signals the beginning of a trend or is an isolated occurrence.
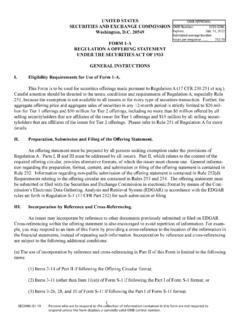
7 Just because a fund had one good year does not mean that positive investment returns will continue. Remember, past performance is not necessarily an indication of future results. Expense Examplethe expense example is calculated using a fund s expense ratio for the preceding six months but does not include the impact of sales loads, if any. the expense example consists of two different tables. the first table shows the actual cost in dollars for a hypothetical $1,000 investment in the fund over a six-month period. Below is an example of this type of table: Six Months Ended January 31, 2013 XYZ FundBased on Actual Beginning Account value ending Account valueexpenses PaidFund Return7/31/20121/31/2013 During PeriodABC shares$1,000$1, $ shares 1,000 1, shares 1,000 1, to the example above, if you owned class ABC shares in the hypothetical XYZ fund , you would have paid $ in expenses for every $1,000 that you owned in the fund during the six-month period identified at the top of thetable.
8 To find out how much your expense was during that six-month period, round the value of the shares you own to the nearest multiple of $1,000 and multiply by the expense example, if you had approximately $25,000 invested in the ABC share class of the hypothetical XYZ fund , yourexpenses would have been: 25 x $ = $ over the six-month Assistance (800) 732-0330 second table in the expense example shows the cost in dollars for a hypothetical $1,000 investment in the fund over the six-month period based on a hypothetical 5% yearly return and not the actual return of the fund during that period. Below is an example of this type of table:Six Months Ended January 31, 2013 XYZ FundBased on Hypothetical Beginning Account value ending Account valueexpenses Paid5% Yearly Return7/31/20121/31/2013 During PeriodABC shares$1,000$1, $ shares 1,000 1, shares 1,000 1, funds are required to use the same hypothetical performance in calculating their expenses for the period covered by the shareholder report, this second table makes it possible for you to compare the expenses of this fund with that of other funds.
9 For example, the table above shows that the expenses paid during the six-month period for class ABC shares assuming a 5% annual return would have been $ per $1,000 invested. You can compare that expense with that of a completely different fund to determine which fund has higher operating expenses. If, for example, that other fund showed an expense ratio of $ per $1,000 invested in a similar share class , that other fund generally would be considered more expensive than the XYZ fund (as stated above, these examples do not include sales loads).Financial Statementsthe annual report contains audited financial statements, including a complete or summary (top 50) list of portfolio holdings. this is where you can learn, among other things, what assets the fund holds (or at least the 50 largest individual holdings), the number of shares owned of each asset, and their market value. regardless of whether the financial statements include the complete list or a summary of portfolio holdings, you can find the full list in the fund s seC filings, which are publicly available through the seC s eDGAr database ( ).
10 Also, if the fund posts its complete list of portfolio holdings online, you may be able to locate that list on the fund s website identified in its annual you review the portfolio holdings, consider the following questions:n Are the fund s holdings, as reflected in the financial statements, consistent with the fund s investment objectives and strategy as stated in the fund s prospectus?Are the fund s holdings consistent with your expectations, based on the fund s name, investment objectives, strategy, and principal risks as disclosed in the fund s prospectus?n Investor Assistance (800) 732-0330 Do you detect any style drift, meaning the fund has strayed from its stated investment objectives (for example, an international stock fund that is unusually concentrated in domestic stocks, or a specific country fund that holds a lot of assets in a country other than the one identified in the name of the fund )?Do the fund s holdings overlap or mirror those of other funds that you own?