Transcription of Ipca Laboratories Ltd.
1 Ipca Laboratories PresentationJune 2018 Company OverviewIncorporation:1949 Present Management :Since 1975 Total income F. Y. 2017-18:` Crs / US$ 505 MnExports F. Y. 2017-18:` Crs / US$ 243 MnExports F. Y. 2017-18:` Crs / US$ 243 MnNumber of Employees:13,294 including 6131in marketing and distributionBusiness Model:Fully integrated pharmaceuticalcompany producing Brandedand Generics Formulations,APIs and IntermediatesFive Years Highlights2013-14 2014-15 2015-16 2016-17 2017-18 Domestic Income ( ` Crs )1, , , , , Income (US $ Mn) Income ( ` Crs )2, , , , , Income ( ` Crs )2, , , , , Income (US $ Mn) Income ( ` Crs )3, , , , , Income (US $ Mn) Profit After Tax ( ` Crs ) Profit After Tax (US $ Mn)
2 FacilitiesFormulationsManufacturing FacilitiesFormulationsLocationDosage FormApprovals / InspectionsAthal, SilvassaTablets & CapsulesUK-MHRA, TGA-Australia,MCC-South Africa,WHO-GenevaRatlam, Madhya PradeshTablets, Liquids, Injectables & OintmentsMCC-South Africa,INVIMA ColombiaKandla, GujaratBetalactum Tablets, Capsules & Dry SyrupsUK-MHRA, MCC-South AfricaSilvassaTablets & CapsulesUK-MHRA, TGA-Australia, HPB-CanadaManufacturing FacilitiesFormulationsLocationDosage FormApprovals / InspectionsDehradun, UttaranchalTablets & Cephalosporin InjectablesWHO-GMPI ndore (SEZ), Madhya PradeshTablets & CapsulesUK-MHRA, HPB Canada,MCC-South AfricaSikkimTablets & CapsulesGMPP ithampur, Dhar , Madhya PradeshHigh Potency Oral Solid DosageWHO-GMPINVIMA ColombiaTarapur, PalgharTabletsManufacturing FacilitiesActive Pharmaceutical Ingredients (APIs)
3 Manufacturing FacilitiesAPIsLocationApprovals / InspectionsRatlam, Madhya PradeshTGA-Australia, EDQM, Danish Regulatory Authority, PMDA-Japan, WHO-Geneva, HPB CanadaIndore, Madhya PradeshWHO-GMPA nkleshwar, Gujarat PMDA JapanAnkleshwar, Gujarat PMDA JapanNandesari, GujaratWHO-GMPA urangabad, MaharashtraWHO-GMPM ahad, MaharashtraGMPRanu (Tehsil Padra), GujaratRevenue Break-upRevenue Break-up2017 - 1876%24%TotalRevenueFormulationsAPIs76%2 4%60%40%TotalRevenueExportsDomestic48%52 %84%16%DomesticFormulationsAPIs89%11%71% 29%ExportsFormulationsAPIs64%36%Revenue Break-upDomestic Exports Total Domestic Exports TotalBranded ` Crs` Crs` Crs` Crs2017-18 Generic Formulations - - Formulations / Intermediates - - ` Crs US$ Mn` Crs US$
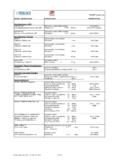
4 Mn% GrowthTotal 2017 - 2016 - 17# After forex gain of ` Crs as against of Rs. ` Crs for previous % # % # % 2017-18FY ` Crs US$ Mn` Crs US$ Mn% GrowthTotal FY19Q1 FY 18# After forex loss of ` Crs as against forex gain of Rs. ` Crs for previous % # % # % Characteristics FY 2017-18 FY 2016-17 Return on Capital Employed % (PBIT / Capital Employed) on Net Worth % (PAT / Net Worth) Asset Turnover Ratio (Total Income / Net Fixed Assets) Employed Turnover Ratio (Total Capital Employed Turnover Ratio (Total Income / Capital Employed) Coverage Ratio (to term loan) (Net Fixed Assets / Total Long Term Borrowings) Term Debt Equity Ratio (Total Long Term Borrowings / Net Worth) Turnover Ratio (Days) (Trade Receivables / Turnover) x 3656859 Creditors Turnover Ratio (Days))
5 (Trade Payables / Purchases) x 365105103 Inventory Turnover Ratio (Days) (Inventory / Turnover) x 365101103 FinancialsGrowthFY 2017-18FY 2016-17 Net Total 17 Therapeutic Segment2017 18 Exports DomesticExports Domestic23%41%Non Steroidal Anti-Inflammatory Drugs (NSAID)20%44%32%21%Cardiovasculars & Anti-Diabetics31%21%16%12%Anti-Malarials 18%8%13%6%Anti-Bacterials10%6%Financials Contribution of Therapeutic Groups2%4%Gastro-Intestinal (GI) Products2%4%5%3%Neuro Psychiatry6%3%1%5%Cough Preparations2%4%-4%Dermatology-5%-2%Urol ogy-3%-1%Neutraceuticals-1%8%1%Others11% 1%100%100%Total100%100%Branded FormulationsDomesticBranded FormulationsDomesticAll India Rank IMS Health : 20th (MAT June 18).
6 25 Depots & 2 C&F Therapy Focused Marketing Strength (PSR/ BA) 2000 brands among top 300 brands (HCQS, Zerodol-P & Zerodol-SP).Market leaders in Anti-malarials & Rheumatoid FormulationsDomestic` CrsUS$ 221 Mn` CrsUS$ 178 Mn` CrsUS$ 190 Mn` CrsUS$ 215Mn2016 - 172014 - 15 Sales2017 - 182015 - 16 Future Growth DriversBranded FormulationsDomesticThe company introduced 20 new Brands / line extensions in the India market during research as a tool to launch innovative combination formulations / Brand building with focused Brand building with focused licensing/ out licensing to build business in the promoted optimization, strategies to identify need gaps to build, enter.
7 Maintain andexit BusinessExports to nearly 120 countries across the Star Trading top 10 pharmaceutical exporters from sales from Business44% sales from to promote brands in more than 30 countries of CIS, South East Asia, Middle East, Latin America and offices in Russia, Ukraine, Vietnam, Philippines, Kenya, Columbia, Sri Lanka, Malaysia and Nigeria (subsidiary company).Formulation dossiers for branded formulations registered in 55 Business` CrsUS$ 242 Mn` CrsUS$ 222 MnInternational Business` CrsUS$ 272 Mn` CrsUS$ 243 Mn2014 - 152015 - 162016 - 17US$ 222 MnSales2017 - 18 International BusinessContinent FormulationsBulk Drugs / Intermediates Total% Exports 2017 18 (```` Crs)
8 ` CrsUS$ 154 Mn` CrsUS$ 192 MnInternationalFormulations` CrsUS$ 143 Mn` CrsUS$ 154 Mn2016 - 172017 - 182014 - 152015 - 16 SalesUS$ 143 MnInternationalBranded Formulations` CrsUS$ 45 Mn` CrsUS$ 53 MnInternationalBranded Formulations` CrsUS$ 37 Mn` CrsUS$ 50Mn2016 - 172015 - 162017 - 182014 15 SalesUS$ 37 MnThrust on brand building in Pain, CVS, CNS, Anti-infective and Anti-malarial expansion in covered countries through additional field in business lines - Institutions and of new products -Existing developed formulations are identified for InternationalBranded FormulationsFuture Growth DriversIntroduction of new products -Existing developed formulations are identified for registration and launch across all RegisteredProducts Under RegistrationUnited Kingdom / Europe611` Crs` CrsUS$ 139 MnAustralia /New Zealand656 South Africa4222 United States / Canada33282016 - 172017 - 182014 - 152015- 16`
9 CrsUS$ 110 MnSales` CrsUS$ 106 Mn` CrsUS$ 104 MnDossiers developed by company approved in UK are being taken for registration in other EU formulations registered to be backed by own of generic dossiers with or without supply Growth DriversSale of generic dossiers with or without supply manufacturing tie up with 3 marketing partners for sale/distribution of Generic ANDAs filed of which 18 ANDAs are to 10 ANDAs targeted for filing for every (b) (2) projects/ Sustained Release Growth Drivers North America505 (b) (2) projects/ Sustained Release contract development and manufacturing ` CrsUS$ 88 Mn` CrsUS$ 80 MnInternationalAPIs` CrsUS$ 79 Mn` CrsUS$ 88 Mn2017 - 182014 - 152015 - 162016 - 17 SalesUS$ 79 MnInternationalAPIs Drug Master FilesSr.
10 Of the APIUS- FDAC anada- HPFBWHOJ apan -PMDA Australia EDQM1 AtenololaaaaaaaaaaaaCEPaaaa2 Artemetheraaaaaaaa3 Artesunateaaaa4 Artesunate Sterileaaaa5 Amodiaquine Hclaaaa6 Amlodipine Besylateaaaaaaaa6 Amlodipine Besylateaaaaaaaa7 AllopurinolaaaaaaaaCEPaaaa8 Beventalol Hclaaaa9 Benzaroneaaaa10 Benzbromaroneaaaa11 Bendroflumethiazideaaaa12 Bisoprolol Fumarateaaaaaaaaaaaa13 Carvedilolaaaaaaaaaaaa14 Cetrizine DihydrochlorideaaaaCEPaaaa15 Chloroquine PhosphateaaaaaaaaInternationalAPIs Drug Master FilesSr. of the APIUS- FDAC anada- HPFBWHOJ apan -PMDA Australia EDQM16 Chlorthalidoneaaaaaaaaaaaa17 Citalopram HBRaaaa18 Dihydroartemesininaaaa19 Etodolacaaaaaaaa20 Famotidineaaaaaaaa21 Fenofibrateaaaaaaaa21 Fenofibrateaaaaaaaa22 Fluconazoleaaaa23 Flumequineaaaa24 FurosemideaaaaaaaaaaaaCEPaaaa25 Glimepirideaaaaaaaaaaaa26 HydrochlorothiazideaaaaaaaaaaaaCEPaaaa27 Hydroxyzine Di Hclaaaaaaaa28 Hydroxychloroquine Sulphateaaaaaaaaaaaa29 Indapamideaaaaaaaaaaaa30 Losartan PotassiumaaaaaaaaCEPaaaaInternationalAPI s Drug Master FilesSr.