Transcription of J384/03 Geographical Exploration Sample Resource Booklet
1 OCR 2015 J384/03 Turn over QN 601/8224/6 T10031/03 GCSE (9 1) Geography B (Geography for Enquiring Minds) J384/03 Geographical Exploration Sample Resource Booklet Time allowed: 1 hour 30 minutes INFORMATION FOR CANDIDATES The questions tell you which resources you need to use. This document consists of 12 pages. Any blank pages are indicated. INSTRUCTION TO EXAMS OFFICER/INVIGILATOR Do not send this Resource Booklet for marking, it should be retained in the centre or recycled. Please contact OCR Copyright should you wish to re-use this document. CONTENTS OF Resource Booklet Fig. 1 Map of the World Fig. 2 Development Indicators Fig.
2 3 Ghana fact file 2014 Fig. 4 Climate graphs for the urban areas of Axim and Tamale in Ghana Fig. 5a Food security map of Ghana Fig. 5b Ecosystem map of Ghana Fig. 6 Opinions on food security in Ghana Fig. 7 Kakum National Park Fig. 8 Sustainable logging plan Fig. 9 Rainforest Biosphere Reserves SPECIMEN2 OCR 2015 J384/03 BLANK PAGE SPECIMEN3 OCR 2015 J384/03 Turn over Fig. 1 Map of the World Fig. 2 Development Indicators GNI per Capita (US$) Life Expectancy at birth Doctors per 1000 people % Access to clean drinking water Australia 65520 82 100 France 42250 82 100 Ghana 1760 66 87 Kenya 930 64 62 Mozambique 590 53 49 Sierra Leone 680 57 60 UK 39140 80 100 USA 53670 80 99 Sources: World Bank GNI PC 2013 & CIA World Fact Book, 2014 SPECIMEN4 OCR 2015 J384/03 Fig.
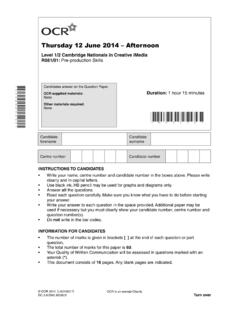
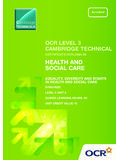
3 3 Ghana fact file 2014 Ghana s Main Exports Cocoa Gold Timber SPECIMEN5 OCR 2015 J384/03 Turn over Fig. 4 Climate graphs for the urban areas of Axim and Tamale in Ghana SPECIMEN6 OCR 2015 J384/03 Fig. 5a Food security map of Ghana Fig. 5b Ecosystem map of Ghana SPECIMEN7 OCR 2015 J384/03 Turn over Fig. 6 Opinions on food security in Ghana SPECIMEN8 OCR 2015 J384/03 Fig. 7 Kakum National Park Fig. 8 Sustainable logging plan Sustainable Logging Allow farmers to only log 20% of the land in a way that the land is not damaged and recovers quickly Encourage farmers to use elephants or other animals to remove logs from areas rather than heavy machinery Each tree must be replaced with another, with rewards for farmers who plant additional trees.
4 Kakum National Park has been open to the public since 1992 and attracts over 150 000 visitors each year. The main feature is the canopy walkway which is 350m long in the canopy allowing visitors to experience the rainforest from a great height. Within the park, visitors can try to spot monkeys, antelope and African elephants. SPECIMEN9 OCR 2015 J384/03 Fig. 9 Rainforest biosphere reserves A biosphere reserve is an area protected to achieve a sustainable balance between the goals of conserving biodiversity, promoting economic development, and maintaining cultural values. SPECIMEN10 OCR 2015 J384/03 BLANK PAGESPECIMEN11 OCR 2015 J384/03 BLANK PAGESPECIMEN12 OCR 2015 J384/03 BLANK PAGE Copyright Information: Fig.
5 3: Image of a cocoa bean blickwinkel. Image supplied by Alamy, , image of a stash of faux gold Pick and Mix Images. Image supplid by Alamy, and image of a truck loaded with timber Mint Images Limited. Image supplied by Alamy, Fig. 7: Image of Kakum Canopy Walk Dory / Alamy. Image supplied by Alamy, , image of logging Olivier Asselin / Alamy. Image supplied by Alamy, , image of cocoa farming Olivier Asselin / Alamy. Image supplied by Alamy, OCR is committed to seeking permission to reproduce all third-party content that it uses in the assessment materials. OCR has attempted to identify and contact all copyright holders whose work is used in this paper. To avoid the issue of disclosure of answer-related information to candidates, all copyright acknowledgements are reproduced in the OCR Copyright Acknowledgements Booklet .
6 This is produced for each series of examinations and is freely available to download from our public website ( ) after the live examination series. If OCR has unwittingly failed to correctly acknowledge or clear any third-party content in this assessment material, OCR will be happy to correct its mistake at the earliest possible opportunity. For queries or further information please contact the Copyright Team, First Floor, 9 Hills Road, Cambridge CB2 1GE. OCR is part of the Cambridge Assessment Group; Cambridge Assessment is the brand name of University of Cambridge Local Examinations Syndicate (UCLES), which is itself a department of the University of Cambridge. specimen OCR 2015 J384/03 Turn over QN 601/8224/6 T10031/02 GCSE (9 1) Geography B (Geography for Enquiring Minds) J384/03 Geographical Exploration Sample Question Paper Date Morning/Afternoon Time allowed: 1 hour 30 minutes You must have: the Resource Booklet You may use: a ruler (cm/mm) a piece of string a scientific or graphical calculator * 0 0 0 0 0 0 * First name Last name Centre number Candidate number INSTRUCTIONS Use black ink.
7 You may use an HB pencil for graphs and diagrams. Complete the boxes above with your name, centre number and candidate number. Answer all the questions. Write your answer to each question in the space provided. If additional space is required, you should use the lined page(s) at the end of this Booklet . The question number(s) must be clearly shown. Do not write in the barcodes. The separate Resource Booklet will be found inside this document. INFORMATION The total mark for this paper is 60. The marks for each question are shown in brackets [ ]. Quality of extended responses will be assessed in questions marked with an asterisk (*). Spelling, punctuation and grammar and the use of specialist terminology (SPaG) will be assessed in questions marked with a pencil ().
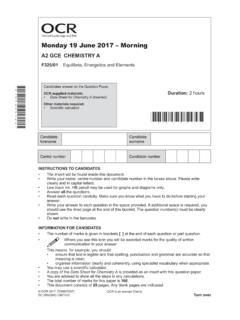
8 This document consists of 12 pages. specimen OCR 2015 J384/03 2 Answer all the questions. 1 (a) Study Figs 1, 2 and 3 in the separate Resource Booklet , a map of the world, a table of development indicators and a Ghana fact file for 2014. (i) Using Fig. 1, describe the location of Ghana.. [2] (i i) Fig. 2 gives development indicators for different countries, including Life Expectancy at birth information. The Life Expectancy at birth for the UK is 80 and for Kenya it is 64. Write the ratio 80:64 in its simplest form.. [1] (b) (i) The scatter graph below shows the relationship between life expectancy at birth and the number of doctors per 1000 people for selected countries.
9 Using the data in Fig. 2, complete this scatter graph by plotting the points for the UK and Ghana. [2]Australia France Kenya Mozambique Sierra Leone USA of Doctors per 1000 people Life Expectancy at Birth Scatter graph showing the relationship between life expectancy at birth and the number of doctors per 1000 people SPECIMEN3 OCR 2015 J384/03 Turn over (b) (ii) Describe the relationship shown between the number of doctors per 1000 people and life expectancy.. [1] (b) (iii) Explain how development indicators, such as life expectancy, show evidence of uneven development.. [3] (c) Discuss how Ghana is typical of an LIDC. Justify your answer using evidence from Figs 2 and 3.
10 [6] SPECIMEN4 OCR 2015 J384/03 2 Study Figs 4, 5a, 5b and 6 in the separate Resource Booklet , showing climate data, maps of Ghana and opinions on food security. (a) (i) Describe how the climate for Axim is different from Tamale. You should use data from Fig. 4 to support your answer.. [3] (ii) Using Fig. 5a, describe the differences in food security in Axim and Tamale.. [2] SPECIMEN5 OCR 2015 J384/03 (b*) The physical geography of Ghana causes its pattern of food security. To what extent do you agree with this statement? Give reasons for your answers and include references to the information in Figs 5a, 5b and 6.. [12] SPECIMEN6 OCR 2015 J384/03 Turn over 3 (a) (i) Using Fig.