Transcription of Jackie Nicholas Janet Hunter Jacqui Hargreaves
1 Functions and Their GraphsJackie NicholasJanet HunterJacqui HargreavesMathematics Learning CentreUniversity of SydneyNSW 2006c 1999 University of SydneyMathematics Learning Centre, University of SydneyiContents1 What is a function? .. Definition of a The Vertical Line Domain of a function .. Range of a function .. Specifying or restricting the domain of a function .. The absolute value function .. 82 More about Modifying functions by Vertical shift .. Horizontal Modifying functions by stretching .. Modifying functions by reflections .. Reflection in Reflection in Other effects .. Combining effects .. Graphing by addition of ordinates .. Using graphs to solve Even and odd functions.
2 Increasing and decreasing functions .. 243 Piecewise functions and solving Piecewise functions .. Restricting the Inequalities .. 35 Mathematics Learning Centre, University of Sydneyii4 Graphs of polynomials and their Behaviour of polynomials when|x|is large .. Polynomial equations and their roots .. Zeros of the quadratic polynomial .. Zeros of cubic polynomials .. Polynomials of higher degree .. Factorising Dividing polynomials .. The Remainder The Factor Theorem .. 495 Solutions to exercises50XY1234532fXY12345362gMathemat ics Learning Centre, University of Sydney11 FunctionsIn this Chapter we will cover various aspects of functions. We will look at the definition ofa function, the domain and range of a function, what we mean by specifying the domainof a function and absolute value What is a function?
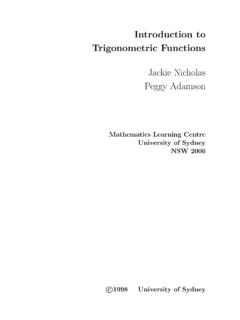
3 Definition of a functionA functionffrom a set of elementsXto a set of elementsYis a rule thatassigns to each elementxinXexactly one way to demonstrate the meaning of this definition is by using arrow :X Yis a function. Every elementinXhas associated with it exactly oneelement :X Yis not a function. The ele-ment 1 in setXis assigned two elements,5 and 6 in function can also be described as a set of ordered pairs (x, y) such that for anyx- value inthe set, there is only oney- value . This means that there cannot be any repeatedx-valueswith examples above can be described by the following sets of ordered {(1,5),(3,3),(2,3),(4,2)}is a {(1,5),(4,2),(2,3),(3,3),(1,6)}is nota definition we have given is a general one. While in the examples we have used numbersas elements ofXandY, there is no reason why this must be so.
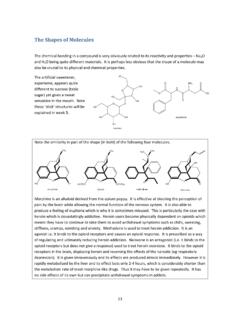
4 However, in these noteswe will only consider functions whereXandYare subsets of the real this setting, we often describe a function using the rule,y=f(x), and create a graphof that function by plotting the ordered pairs (x, f(x)) on the Cartesian Plane. Thisgraphical representation allows us to use a test to decide whether or not we have thegraph of a function: The Vertical Line y 0xMathematics Learning Centre, University of The Vertical Line TestThe Vertical Line Test states that if it isnot possibleto draw a vertical line through agraph so that it cuts the graph in more than one point, then the graphisa is the graph of a function. All possi-ble vertical lines will cut this graph is not the graph of a function. Thevertical line we have drawn cuts thegraph Domain of a functionFor a functionf:X Ythedomainoffis the also corresponds to the set ofx-values when we describe a function as a set of orderedpairs (x, y).
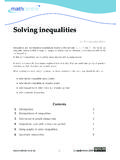
5 If only the ruley=f(x) is given, then the domain is taken to be the set of all realxforwhich the function is defined. For example,y= xhas domain; all realx 0. This issometimes referred to as thenaturaldomain of the Range of a functionFor a functionf:X Ytherangeoffis the set ofy-values such thaty=f(x) corresponds to the set ofy-values when we describe a function as a set of orderedpairs (x, y). The functiony= xhas range; all realy the domain and range ofy= x+ , showing significant features, the graph ofy= x+4. 4 2 1xy101 331 2xy02468 1 2 3 Mathematics Learning Centre, University of domain ofy= x+ 4 is all realx 4. We know that square root functions areonly defined for positive numbers so we require thatx+4 0, iex 4. We alsoknow that the square root functions are always positive so the range ofy= x+4isall realy graph ofy= x+ the equation of the parabola sketched below, which has vertex (3, 3).
6 The domain and range of this equation of the parabola isy=x2 domain of this parabola is all realx. The range is all realy +y2= 16 and explain why it is not the graph of a +y2= 16 is not a function as it fails the vertical line test. For example, whenx=0y= 4y0 224 2x 40213 112xyMathematics Learning Centre, University of Sydney4 The graph ofx2+y2= the graph off(x)=3x x2and domain and (q) (x2) (2+h) f(2)h,h = graph off(x)=3x domain is all realx. The range is all realywherey (q)=3q q2 2x 246y024 Mathematics Learning Centre, University of (x2)=3(x2) (x2)2=3x2 (2 +h) f(2)h=(3(2 +h) (2 +h)2) (3(2) (2)2)h=6+3h (h2+4h+4) 2h= h2 hh= h 1 ExampleSketch the graph of the functionf(x)=(x 1)2+ 1 and show thatf(p)=f(2 p).Illustrate this result on your graph by choosing one value graph off(x)=(x 1)2+ (2 p) = ((2 p) 1)2+1=(1 p)2+1=(p 1)2+1=f(p) 2x 246y024 1x24y021 Mathematics Learning Centre, University of Sydney6 The sketch illustrates the relationshipf(p)=f(2 p) forp= 1.
7 Ifp= 1 then2 p=2 ( 1) = 3, andf( 1) =f(3). Specifying or restricting the domain of a functionWe sometimes give the ruley=f(x) along with the domain of definition. This domainmay not necessarily be the natural domain. For example, if we have the functiony=x2for 0 x 2then the domain is given as 0 x 2. The natural domain has been restricted to thesubinterval 0 x , the range of this function is all realywhere 0 y 4. We can bestillustrate this by sketching the graph ofy=x2for 0 x 2| 2|=2 |4|=4ax| | = | |a xx ay = x x < 0y1120 1x2 2y = x x 0 Mathematics Learning Centre, University of The absolute value functionBefore we define the absolute value function we will review the definition of the absolutevalue of a value of a numberxis written|x|and is defined as|x|=xifx 0or|x|= xifx< is,|4|= 4 since 4 is positive, but| 2|= 2 since 2 is can also think of|x|geometrically as the distance ofxfrom 0 on the number generally,|x a|can be thought of as the distance ofxfromaon the that|a x|=|x a|.
8 The absolute valuefunctionis written asy=|x|.We define this function asy= +xifx 0 xifx<0 From this definition we can graph the function by taking each part separately. The graphofy=|x|is given graph ofy=|x|.y1120x2y = x 2 x 2 y = x + 2 x < 234 Mathematics Learning Centre, University of Sydney8 ExampleSketch the graph ofy=|x 2|.SolutionFory=|x 2|we havey= +(x 2) whenx 2 0orx 2 (x 2) whenx 2<0orx<2 That is,y= x 2forx 2 x+ 2 forx<2 Hence we can draw the graph in two graph ofy=|x 2|.We could have sketched this graph by first of all sketching the graph ofy=x 2 andthen reflecting the negative part in thex-axis. We will use this fact to sketch graphs ofthis type in Chapter Exercises1. the domain and range off(x)= 9 the graph ofy= 9 (x)=x2+ 5, find, in simplest form, (x+h) (x)hh = the following functions stating the domain and range of each:Mathematics Learning Centre, University of x |2x| |2x| the perpendicular distance from (0,0) to the linex+y+k= the linex+y+k= 0 cuts the circlex2+y2= 4 in two distinct points, find therestrictions the following, showing their important 12 the meanings of function, domain and range.
9 Discuss whether or noty2=x3is a the following relations, showing all intercepts and features. State which onesare functions giving their domain and 4 x2b.|x| |y|= |x|,x =0e.|y|= (x)=x2+2+1x2,x = 0, prove thatA(p)=A(1p) for allp = down the values ofxwhich are not in the domain of the following (x)= x2 (x)=xx2 (x) = log xx 1 , find in simplest form:a. (3) + (4) + (5)b. (3) + (4) + (5) + + (n)11. +2xandx=(z 2)2, findywhenz= (x)=2x+ 1 andM(x)=x2 x, (M(x)) (L(x)) 11xy2 0 2( 2,1) 0x 2y215(2,1)Mathematics Learning Centre, University of the sketches, find the value (s) of the constants in the given equations:y=ax2 by=abx2+113. |a|, the absolute value ofa, whereais the relation|x|+|y|= thatS(n)=n2n+1, find an expression forS(n 1).Hence show thatS(n) S(n 1) =1(2n 1)(2n+1).
10 2y1 1 203 32(1, 2)x(1,1)y = x2y = x 3 Mathematics Learning Centre, University of Sydney112 More about functionsIn this Chapter we will look at the effects of stretching, shifting and reflecting the basicfunctions,y=x2,y=x3,y=1x,y=|x|,y=ax ,x2+y2=r2. We will introduce theconcepts of even and odd functions, increasing and decreasing functions and will solveequations using Modifying functions by Vertical shiftWe can draw the graph ofy=f(x)+kfrom the graph ofy=f(x) as the addition ofthe constantkproduces avertical shift. That is, adding a constant to a function movesthe graph upkunits ifk>0ordownkunits ifk<0. For example, we can sketch thefunctiony=x2 3 from our knowledge ofy=x2by shifting the graph ofy=x2downby 3 units. That is, iff(x)=x2thenf(x) 3=x2 can also writey=f(x) 3asy+3=f(x), so replacingybyy+3 iny=f(x) alsoshifts the graph down by 3 Horizontal shiftWe can draw the graph ofy=f(x a) if we know the graph ofy=f(x) as placing theconstantainside the brackets produces ahorizontal shift.