Transcription of Jail Inmates in 2020 – Statistical Tables
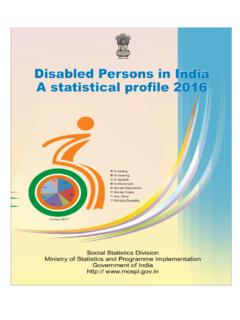
1 Department of Justice Office of Justice Programs Bureau of Justice StatisticsBureau of Justice Statistics Statistical TablesDecember 2021, NCJ 303308 The number of Inmates in local jails across the United States decreased 25% from midyear 2019 (734,500) to midyear 2020 (549,100), after a 10-year period of relative stability (figure 1; table 1). About 167 Inmates per 100,000 residents were incarcerated in local jails at midyear 2020, down from 224 per 100,000 in number of persons admitted to local jails also decreased from 2019 to 2020, from million to million. This 16% decline was more than six times the decrease in jail admissions each year from 2010 to 2019. The large declines in jail admissions and midyear populations from 2019 to 2020 Todd D. Minton and Zhen Zeng, , BJS StatisticiansJail Inmates in 2020 Statistical TablesNote: See table 1 for counts and appendix table 1 for standard : Bureau of Justice Statistics, Annual Survey of Jails, 2010 2018 and 2020; and Census of Jails, 1 Number of Inmates confined in local jails at midyear, 2010 2020 Inmates confined in local jails0100,000200,000300,000400,000500,00 0600,000700,000800,000202020192018201720 16201520142013201220112010can be attributed mainly to the COVID-19 in this report are based on the 2010 2018 and 2020 Annual Survey of Jails (ASJ) and the 2019 Census of Jails (COJ).
2 Additional data on staffing was drawn from the 2013 COJ. The Bureau of Justice Statistics (BJS) periodically conducts the COJ, a complete enumeration of local jail facilities. In the years between the COJ, BJS conducts the ASJ, a national survey administered to a sample of approximately 900 jail jurisdictions, to provide national statistics on the number and characteristics of local jails. See Methodology for the ASJ sample more information, see Impact of COVID-19 on the Local Jail Population, January June 2020 (NCJ 255888, BJS, March 2021) at Inmates in 2020 Statistical Tables | December 2021 2 TablE 1 Inmates confined at midyear, average daily population, annual admissions, and incarceration rates, 2010 2020 YearConfined inmatesaAverage daily populationbAnnual admissionscJail incarceration rated2010748,700 748,600 12,900,000 242 2011735,600 735,600 11,800,000 236 2012744,500 737,400 11,600,000 237 2013731,200 731,400 11,700,000 231 2014744,600 739,000 11,400,000 234 2015727,400 719,500 10,700,000 227 2016740,700 731,300 10,600,000 229 2017745,200 745,600 10,600,000 229 2018738,400 737,900 10,700,000 226 2019734,500 741,900 10,300,000 224 2020*549,100658,1008,700,000167 Average annual percent change 2010 change2019.
3 Data are rounded to the nearest 100 for confined Inmates and for average daily population (ADP) and to the nearest 100,000 for annual admissions. Results may differ from previous reports in the series due to data updates from jail authorities. See appendix table 1 for standard errors.*Comparison year. Difference with comparison year is significant at the 95% confidence level. aNumber of Inmates held on the last weekday in ADP is the sum of all Inmates in jail each day for 1 year, divided by the number of days in the year. The ADP for 2015 and 2016 was calculated for the calendar year ending on December 31. The ADP for all other years was calculated for the 12-month period ending on June admissions from 2010 to 2014 were estimated based on admissions during a 1-week period in June. The 2015 and 2016 annual admissions were for the calendar year ending on December 31. The 2017 to 2020 annual admissions were for the 12-month period ending on June of confined Inmates in local jails at midyear per 100,000 : Bureau of Justice Statistics, Annual Survey of Jails, 2010 2018 and 2020, and Census of Jails, 2019; and Census Bureau, Population Estimates by Age, Sex, Race, and Hispanic Origin for the United States: January 1, 2010 to January 1, Inmates in 2020 Statistical Tables | December 2021 3 Key findingsDemographic characteristics of local jail Inmates After increasing an average of 2% per year from 2010 to 2019, the number of females confined in local jails decreased 37% from midyear 2019 to midyear 2020 (table 2).
4 The number of males declined 23% during this same period. The number of juveniles held in local jails declined 21% from midyear 2019 (2,900) to midyear 2020 (2,300) (table 2). The number held at midyear 2020 was the lowest since midyear From 2019 to 2020, the number of white Inmates dropped from 362,900 to 262,100 (down 28%), while the number of black Inmates dropped from 247,100 to 192,600 (down 22%) (table 2). At midyear 2020, about 48% of Inmates held in local jails were white, 35% were black, and 15% were Hispanic. American Indians or Alaska Natives; Asians, Native Hawaiians, or Other Pacific Islanders; and persons of two or more races accounted for 2% of the total jail population (table 3). At midyear 2020, Inmates ages 18 to 34 accounted for 53% of the jail population, while Inmates age 55 or older made up 7% (table 3).Jail incarceration rate After declining at an average rate of nearly 1% annually from 2010 to 2019, the jail incarceration rate dropped 26% from 2019 (224 per 100,000 residents) to 2020 (167 per 100,000 residents) (table 4).
5 From 2019 to 2020, the jail incarceration rate declined 37% for females and 23% for males (table 4). Males were incarcerated at a rate (295 per 100,000 male residents) more than seven times the rate for females (42 per 100,000 female residents) at midyear 2020 (table 4). At midyear 2020, persons ages 25 to 34 (421 per 100,000 residents in this age group) were incarcerated at a higher rate than persons ages 35 to 44 (337 per 100,000) and persons ages 18 to 24 (329 per 100,000) (table 4).2 For counts of juveniles held in local jails for midyear 2011 through midyear 2014, see Jail Inmates in 2017 (NCJ 251774, BJS, April 2019) available at Black residents (465 per 100,000 persons) were incarcerated at times the rate of white residents (133 per 100,000 persons) at midyear 2020. This marked a decrease from midyear 2010, when the rate for black residents (745 per 100,000) was times that of white residents (167 per 100,000) (table 4).Conviction status and offense severity of local jail Inmates Between midyear 2019 and midyear 2020, the convicted population (down 34%) in local jail declined more than the unconvicted population (down 21%) (table 5).
6 From 2019 to 2020, the number of Inmates held for felony offenses declined 18% (down 92,700 Inmates ), while those held for misdemeanor offenses declined 45% (down 76,300 Inmates ) (table 5).3 At midyear 2020, 77% of all local jail Inmates were held for felony offenses and 17% were held for misdemeanor offenses (table 6). The remaining 6% were held for civil infractions or unknown offenses. The number of probation violators declined 25% from 2019 to 2020. Similar to midyear 2019, probation violators accounted for 13% of all Inmates at midyear 2020 (table 7).Jail Inmates held for federal, state, or tribal authorities A total of 107,100 jail Inmates were held for federal, state, or tribal government authorities at midyear 2020 (table 8). The majority (59%) were held for state prison authorities. About 20% of all jail Inmates were held for federal, state, or tribal government authorities at midyear 2020, an increase from 16% at midyear 2019 (table 8). Jail Inmates held for state prison authorities declined 12,300 (down 16%) from 2015 to 2019, but remained stable from 2019 to 2020 (table 8).
7 The number of local jail Inmates held for Immigration and Customs Enforcement declined 46% between midyear 2019 (17,300) and midyear 2020 (9,300) (table 8).3 For Inmates held for multiple offenses, classification was based on the most serious offense, , the offense that carries the longest sentence, regardless of conviction Inmates in 2020 Statistical Tables | December 2021 4 Jail size distribution Jail jurisdictions holding fewer than 100 Inmates accounted for more than half (56%) of the 2,843 jail jurisdictions in the United States and held 9% of the total average daily population (ADP) from July 1, 2019 to June 30, 2020 (table 9). Jail jurisdictions holding 1,000 or more Inmates accounted for 4% of all jail jurisdictions in the United States and held 38% of the total ADP from July 1, 2019 to June 30, 2020 (table 9). The median ADP of local jails from July 1, 2019 to June 30, 2020 was 75 Inmates , while the mean ADP was 231 Inmates (table 9).Capacity and occupancy rate of local jails The rated capacity in local jails remained relatively stable between midyear 2019 (907,700 beds) and midyear 2020 (913,700 beds) (table 10).
8 As a result of the 25% decrease in the jail population between midyear 2019 and midyear 2020, 4 in 10 jail beds were unoccupied at midyear 2020 (table 10). Seven percent of all jail jurisdictions were operating above their rated capacity at midyear 2020, a decrease from 15% at midyear 2019 (table 10). At midyear 2020, 6 in 10 beds in jail jurisdictions holding fewer than 50 Inmates were unoccupied, compared to 4 in 10 beds in jail jurisdictions holding 50 or more Inmates (table 11). No jail jurisdictions holding 2,500 or more Inmates reported being over capacity at midyear 2020, compared to about 10% of jails holding 50 to 999 Inmates (table 11).Turnover rate and average time in jail The weekly inmate turnover rate in jails nationwide was 50% in 2020, a decline from 53% in 2019 and 65% in 2010 (table 12). The average amount of time an inmate spent in jail (time in custody from admission to release) increased by nearly 2 days between June 2019 (26 days) and June 2020 (28 days) (table 12).
9 Jail jurisdictions with an ADP of fewer than 50 Inmates experienced the highest inmate turnover rate (114%), more than three times the rate of jail jurisdictions holding 2,500 or more Inmates (36%) in 2020 (table 13). In 2020, the average length of stay of jail Inmates was three times as long in jail jurisdictions with an ADP of 2,500 or more (39 days) as in jail jurisdictions with an ADP of fewer than 50 Inmates (12 days) (table 13).Unconfined persons under jail supervision and weekenders While the confinement population declined between midyear 2019 and midyear 2020, the number of persons under jail supervision in a program outside of a jail facility increased by 11,400 (29%) (table 14). The percentage of jail jurisdictions supervising persons outside of a jail facility increased from 15% of all jails at midyear 2019 to about 19% at midyear 2020 (not shown in Tables ). About 2,200 persons served weekend-only sentences on the weekend before the last weekday in June 2020, a decline of 66% from the weekend before the last weekday in June 2019 (6,500) (table 15).
10 Correctional staff employed in local jails Local jails employed 233,200 staff (including 184,900 correctional officers) at midyear 2020, similar to the number at midyear 2019 (table 16). Due to relative stability in the number of correctional officers and recent declines in inmate populations, the inmate-to-correctional-officer ratio declined from about 4 to 1 each year from 2013 to 2019, to 3 to 1 at midyear 2020 (table 16). In 2020, males accounted for about 6 in 10 of all jail staff and 7 in 10 correctional officers (table 16). Each year between 2013 and 2020, about 8 in 10 staff employed in local jails were correctional officers (table 17). Terms and definitionsAdmissions All persons booked into and housed in jail facilities by formal legal document and the authority of the courts or some other official agency, including repeat offenders booked on new charges and persons sentenced to weekend programs or entering the facility for the first time. They exclude Inmates reentering the facility after an escape, work release, medical appointment, a stay in a treatment facility, and a bail or court annual percent change The compound annual growth rate, calculated by taking the log of the ratio of current year population to base year population, divided by elapsed time in years, and multiplied by daily population (ADP) The total number of Inmates in jail each day for a year, divided by the number of days in the average time in jail Calculated by dividing the ADP by the number of annual admissions, then multiplying the product by the number of days in a custody In the physical custody of local jails, regardless of conviction status or which authority has jurisdiction over the A confinement facility generally operated under the authority of a sheriff, police chief, or county or city administrator.