Transcription of January 2010 Assistant Chief Economist RRSP …
1 Paul FerleyAssistant Chief ANALYSISJ anuary 2010 RRSP contributions 1968 to andbeyond to 2020 SummaryThis study of Registered Retirement Savings Plans (RRSPs) in Canada over thepast forty years finds that RRSP contributions as a share of income have declinedover the past eleven years after steadily rising to a peak in 1997. The analysissuggests demographic factors and related distinct savings patterns among vari-ous age cohorts are the main drivers of both the run-up in RRSP contributionsprior to 1997 and the drop off seen since. As the aging of the population becomesmore pronounced over the next decade, particularly with respect to the babyboom generation, this research suggests that RRSP contributions will likely con-tinue to trend lower over the next fall-off in contributions has raised concerns among public policy analyststhat Canadians may not be adequately saving for their retirement.
2 While this hasnot been proven in this analysis, a falloff in savings does have a clearly negativeimpact for the overall economy. Decreased savings means fewer funds availabledomestically to finance investment activity. This may be reason enough for policymakers to try and encourage the various age cohorts to increase savings goingforward. Such could be achieved through policies that enhance the current RRSP program such as raising contribution limits or extending the age by which RRSP sneed to be cashed out. Alternatively, policy could be directed toward enhancingother saving vehicles such as raising the annual contribution limits of the newlyintroduced tax free savings accounts (TFSAs).
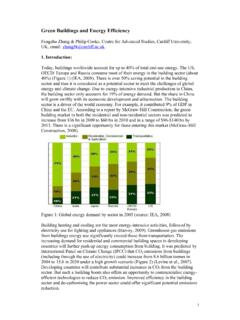
3 AnalysisA graph of RRSP contributions as a percent of personal disposable income (PDI)from the late 1960 s (see chart 1) shows a steady upward trend for three , from the late 1990 s, contributions have trended lower through 2008. Thispaper will examine the factors behind the break in this trend. One of the keyfindings is the important role played by demographic factors and that each agecohort has shown a distinct savings pattern over the past forty years. The paperconcludes that these demographic factors will likely result in RRSP contributionscontinuing to trend lower as a percent of income over the next ten years as agrowing number of the baby boom generation2 retires and thus starts to reduceRRSP contributions.
4 This conclusion is premised on unchanged savings behav-iour among the various age I RESEARCHC hart 1: RRSP Contributions012345619681972197619801984 198819921996200020042008%Contributions as a % of personal disposable incomeSource: Statistics Canada, RBC Economics Research2 Chart 2: RRSP contributors01,0002,0003,0004,0005,0006, 0007,00019681972197619801984198819921996 200020042008000's of people05101520253035%Contributors (LHS)% of total tax filers* (RHS)Source: Statistics Canada, RBC Economics Research*Total number of taxfilers for 1988 and 1989 were unav ailable at the time of this study and as such a gap exists in the data*Chart 3: RRSP contributors by age group8001,0001,2001,4001,6001,8002,00019 9419951996199719981999200020012002200320 042005200620072008000' s of people0-3435-4445-5455+Source: Statistics Canada, RBC Economics ResearchChart 4.
5 Population by age group23456789101971 1974 1977 1980 1983 1986 1989 1992 1995 1998 2001 2004 2007 2010 2013 2016 2019 Millions of people25-3435-4445-5455-74 Source: Statistics Canada, RBC Economics ResearchRegistered retirement savings plans (RRSPs) were introduced in Canada in 1957when the Federal government amended the Income Tax Act to permit individualsto shelter financial assets, intended to be used for future retirement income, fromincome taxes. This allowed individuals to receive the tax advantages alreadyenjoyed by members of registered employer-sponsored pension plans (RPPs).
6 Participants in RRSPs were allowed to annually contribute 10% of earned in-come up to $2,500 ($19,300 in 2008 dollars). RPP participants were allowed tocontribute 10% of earned income as well though to a lower maximum of $1,500($11,600 in 2008 dollars) reflecting pension contributions made by the employeron the employee s proportion of RRSP contributions relative to PDI grew steadily from the late1960 s to the late 1990 s, with the rate increasing from in 1968 to in1997. However, since 1997, there has been a decidedly downward trend in thisRRSP savings rate as total contributions represented only of PDI in affecting RRSP contributionsi) DemographicsThe number of contributors in RRSPs increased dramatically in the early years ofthe program due to the greater individual awareness of the need to save forretirement, an increased desire to maximize use of tax shelter opportunities, anda response by taxfilers to the annual advertising campaigns by financial institu-tions.
7 3 The number of contributors increased from 172,000 (roughly 2% of all tax filers)in 1968 (the first year for which data is available on number of contributors) to in 1979 (12% of all tax filers), and peaked at million (30% of all tax filers)in 1997 (see chart 2). The one break in this upward trend (through to the 1997peak) came in 1990, which coincided with an economic recession in Canada. Thisbreak saw the number of contributors fall by roughly 100,000 compared to theprevious turn of this century has seen the number of contributors essentially remainconstant, while the participation rate has fallen to 26% of all tax filers through2008.
8 Chart 3 shows RRSP contributors by various age cohorts and suggeststhat an important factor driving this structural change in RRSP contributionscould be demographics (the chart starts only in 1994 reflecting the earliest avail-ability of the data by age cohort). It shows a downward trend in the number ofcontributors among the 0-34 and 35-44 age groups that coincides with the timingof the general downward trend in contributions. To illustrate this point, chart 4depicts the Canadian population by age group. It shows the aging of the babyboom generation as that generation moves through the older age categories(population numbers beyond 2008 reflect projections done by Statistics Cana-da).
9 These demographic trends have been overlaid by very distinct RRSP contribu-tions by age cohorts, as shown in chart 5. At least a part of the rapid run-up inRRSP contributions over the 1980s and through the early 1990s could be ex-plained by the entrance of the baby boomers into the 35-44 age category and an3 Chart 5: RRSP contributions by age group, 1994-20080123450-3435-4445-5455+Average contribution as a % of personal income for 1994-2008 Source: Statistics Canada, RBC Economics ResearchRRSP contributions as a % of personal income**Personal disposable income by age group was unavailable at the time of this study and personal income was used in its lChart 6.
10 RRSP contribution growth-20-100102030405060708090100110196 8197219761980198419881992199620002004200 8 Policy changeRecession/slowdownTotal contributionsSource: Statisti cs Canada, Gov ernment of Canada, RBC Economics Research% change, year-over-yearaccompanying large marginal increase in RRSP contributions. As the babyboomers began to pass through that age category, the marginal increase insaving fell, leading to a flattening of total of the population aged 35-44 slowed in the late 1990s, peaking in 2001before declining through the remainder of the current decade.