Transcription of JEPPESEN AIRLINE CHART SERIES
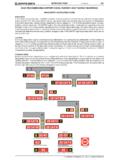
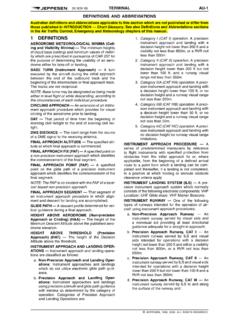
1 JEPPESEN AIRLINE CHART SERIES JEPPESEN AIRLINE CHART SERIES JEPPESEN AIRLINE CHART SERIES FEATURES Extensive global CHART library To-scale approach CHART depiction of Minimum Sector Altitude (MSA) displayed in the plan view and heading for increased situational awareness Non-precision approach charts support Constant Descent Final approach (CDFA) technique whenever possible Tailored minimums to meet specific carrier operation requirments SID/DP/STAR overview charts for at a glance reference using simplified depiction of procedures relative to terrain, special use airspace and other routes Critical information is quickly available to Aircrews when they need it Consolidated ILS minimums reduces CHART sheet counts JEPPESEN AIRLINE CHART SERIES approach CHART Heading Index oval. A square-end oval outline is used to distinguish JEPPESEN AIRLINE charts from standard charts. The AIRLINE CHART icon is placed between the airport name and the revision date.
2 ILS/MLS/LOC approach charts. The former reference to CAT II and III suffixes in the procedure title are routinely being omitted by various States according to ICAO recommendations. All applicable ILS categories will be combined on one CHART , if space permits. Plan View MSAs. JEPPESEN AIRLINE approach charts clearly depict MSAs in both the heading and plan view. The brown color and bold font immediately distinguishes MSAs from other information. DME reference circles. Whenever a suitable VORDME is available (within 6 NM of the ARP), relevant distance and radial information is shown, spaced at intervals of 5 NM for both precision and non-precision approaches. Where no suitable VORDME is available, DME reference circles (printed in blue) are centered on an ILS/LOCDME, stand-alone DME or TACAN. Secondary IFR/VFR airports. Printed in blue. 1 2 2 45 56 3 4 31 JEPPESEN AIRLINE CHART SERIES Terrain contours. Additional terrain contours are depicted on JEPPESEN AIRLINE approach charts.
3 The lowest contour shown is at least 400 feet above the airport elevation beginning with the source CHART s next higher 1,000 foot interval. Criteria for displaying terrain on standard charts is a 2,000 rise above the airport elevation within 6 NM of the airport or 4,000 above the airport elevation within the limits of the charted plan view. Special use airspace (prohibited, restricted and danger areas). The wide crosshatched band used on standard charts is replaced by a thin solid line. Outlines and labels are printed in blue. Profile View Recommended altitude descent table (DME ribbon). When not already State-supplied, a DME ribbon is shown beginning at the FAF when a suitably located DME is used in the procedure. The DME ribbon is generally shown for all non-precision approaches (VOR, NDB, LOC, etc.), provided certain criteria is met to accommodate a continuous rate of descent until reaching the minimum. A maximum of nine altitudes will be shown in increments of 1 NM in even DME distances sequenced in the profile s direction of flight.
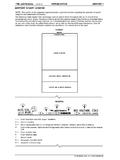
4 Recommended altitudes, if not already a multiple of ten, will always be rounded up to the next higher 10 foot increment. Ground speed-Kts table. A modified Gnd speed-Kts box replaces the standard box to better match the typical approach speeds of category C and D aircraft. Minimums Minimums block. Only the best minimums condition, such as With DME or With Local Altimeter Setting are shown and conditions that require higher minimums are footnoted. Full ILS minimums are always shown combined with non-precision LOC (GS out) minimums. However, if space does not permit all precision and non-precision minimums, a separate non-precision approach CHART is created. Where applicable, standard ILS CAT II, IIIA and IIIB values are included. All information in the minimums block can be tailored to specific operations specifications. 6 8 89 910 10 7 7 JEPPESEN AIRLINE CHART SERIES Sample charts for comparison Standard AIRLINE SID/DP/STAR Overview CHART JEPPESEN AIRLINE CHART SERIES General SID/DP/STAR overview charts are drawn to scale and provide a wealth of useful information, however, they are not intended for navigation.
5 They enhance terrain and general situational awareness, and provide basic information for flight planning. If subscribed to by your AIRLINE , these optional overview charts are used with the associated standard SID/DP/STAR charts. Heading Index oval. A square-end oval outline is used to distinguish AIRLINE charts from standard charts. The AIRLINE CHART icon is placed between the airport name and the revision date. Overview charts are filed before the 10-2/10-3 SID/DP/STAR charts. The index numbers are 10-1S, 10-1S1, 10-1S2 etc. SID/STAR overview block. A negative-print SID OVERVIEW or STAR OVERVIEW block is shown top right below the location/country name to indicate the purpose of the CHART . Arrival/departure runways. All runways that have SID/STAR routes are shown in the heading. Examples: STAR OVERVIEW RWYS 04, 06, 09 SID OVERVIEW RWYS 15, 18L/R ALL RWYS is shown if only one SID or STAR overview sheet exists. Plan View DME reference circles.
6 Whenever a suitable VORDME is available (within 10 NM of the ARP) DME reference circles are shown. Where no suitable VORDME is available, DME reference circles are centered on an ILS/LOCDME, stand-alone DME or TACAN. DME reference circles are printed in blue. Special use airspace. Only prohibited airspace is shown. The wide crosshatched band used on standard charts is replaced by a thin solid line. Outlines and labels are printed in blue. Secondary IFR/VFR airports and hydrography. Printed in blue. 1 12 23 34 45 56 67 JEPPESEN AIRLINE CHART SERIES SID/DP/STAR Overview CHART (cont.) Contours, terrain high points and man-made structures. A contour interval legend block replaces the contour values normally shown along the contour lines. The lowest starting contour is at least 1,500 feet above airport elevation. If no contours are shown, no terrain high points/man-made structures are charted unless the man-made structures are 1,000 feet AGL or higher.
7 Controlled airspace. Only the outermost airspace boundaries are shown together with their names. Airspace boundaries are printed in blue. NAVAIDs, airspace fixes and distances. All NAVAIDs charted on the standard SID/DP/STAR charts are shown on the overview charts (Morse code and frequencies are omitted for simplification). Airspace fixes are generally omitted except those designated as IAFs and those that define the beginning/end points of the enroute transitions and named SID/STAR routes. Distances along routes are omitted except when the beginning/end point is off CHART . All distances are in whole miles. 7 8 89 9 9 JEPPESEN AIRLINE CHART SERIES SID/DP/STAR Overview CHART (cont.) Sample charts