Transcription of Jharkhand Profile - 2011 Census of India
1 Sex ratio, 0 - 6 yrs (Rural)957 Sex ratio, 0 - 6 yrs (Urban)908102198824852032136013535653 Population size, 0 - 6 yrs (Urban Females)276714726223484367507 Population size, 0 - 6 yrs (Rural Males)Population size, 0 - 6 yrs (Rural Females)Population size, 0 - 6 yrs (Urban Males)Literacy rate, 7+ yrs (Rural Females, Per cent) rate, 7+ yrs (Urban Males, Per cent) rate, 7+ yrs (Urban Females, Per cent) , 7+ yrs (Urban Females) ratio (Urban)Literacy rate, 7+ yrs (Rural, Per cent) rate, 7+ yrs (Males, Per cent)Sex ratio (Rural)961 Literacy rate, 7+ yrs (Females, Per cent)910 Sex ratio (Females per 1000 males)3199788 Jharkhand ProfilePopulation size32988134 Population size (Rural Males)1277648694818328069 Population size, 0 - 6 yrs (Rural)Population size, 0 - 6 yrs (Urban)Population size (Males)Population size (Females)1693031516057819 Sex ratio, 0 - 6 yrs (Females per 1000 males)Literates, 7+ yrsLiterates, 7+ yrs (Females)Literates, 7+ yrs (Urban)Population size (Urban Females)3779232 Literacy rate, 7+ yrs (Persons, Per cent)414 Population density (Total, Persons per sq km)76827314960347 Literacy rate, 7+ yrs (Rural Males, Per cent)Literates, 7+ yrs (Males)Literates, 7+ yrs (Rural) size (Rural Females)12278587 Population size (Urban Males)4153829 Literates, 7+ yrs (Rural Males)Literates, 7+ yrs (Rural Females)Literates, 7+ yrs (Urban Males) size (Rural)Population size (Urban)Population size, 0 - 6 yrs (Males)Population size, 0 - 6 yrs (Females)793306125055073 Population size, 0 - 6 yrsLiteracy rate, 7+ yrs (Urban, Per cent).
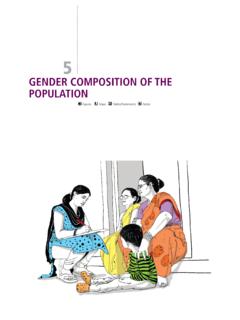
2 Census of India 2011223149426,945,829 32,988,134 13,885,037 16,930,315 13,060,792 16,057,819 010,000,00020,000,00030,000,00040,000,00 020012011 PersonsMalesFemales20,952,088 25,055,073 10,679,596 12,776,486 10,272,492 12,278,587 05,000,00010,000,00015,000,00020,000,000 25,000,00030,000,00020012011 PersonsMalesFemales5,993,741 7,933,061 3,205,441 4,153,829 2,788,300 3,779,232 02,000,0004,000,0006,000,0008,000,00010, 000,00020012011 PersonsMalesFemalesTotal Rural Urban 4,956,827 5,389,495 2,522,036 2,767,147 2,434,791 2,622,348 01,000,0002,000,0003,000,0004,000,0005,0 00,0006,000,00020012011 PersonsMalesFemalesPopulation size, 0-6 yrs Number 4,110,326 4,367,507 2,083,426 2,231,494 2,026,900 2,136,013 01,000,0002,000,0003,000,0004,000,0005,0 00,00020012011 PersonsMalesFemales846,501 1,021,988 438,610 535,653 407,891 486,335 0200,000400,000600,000800,0001,000,0001, 200,00020012011 PersonsMalesFemalesPopulation size Number Total Rural Urban Source: Census of India 2011* The area figure exclude 78,114 sq.
3 Km. under the illegal occupation of Pakistan, 5,180 sq. km. Illegally handed over by Pakistan to China and 37,555 under the illegal occupation of China in Ladakh district. Rural Urban Areas: The data in the table on Provisional Population Totals are presented separately for rural and urban areas. The unit of classification in this regard is 'town' for urban areas and 'village' for rural areas. In the Census of India 2011, the definition of urban area adopted is as follows: (a) All statutory places with a municipality, corporation, cantonment board or notified town area committee, etc. (b) A place satisfying the following three criteria simultaneously: i) a minimum population of 5,000; ii) at least 75 per cent of male working population engaged in non-agricultural pursuits; and iii) a density of population of at least 400 per sq. km. (1,000 per sq. mile).For identification of places which would qualify to be classified as 'urban' all villages, which, as per the 2001 Census had a population of 4,000 and above, a population density of 400 persons per sq.
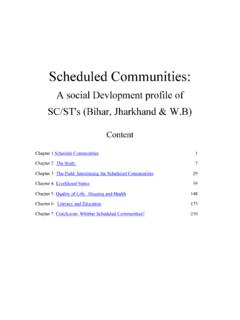
4 Km. and having at least 75 per cent of male working population engaged in non-agricultural activity were considered. An area is considered 'Rural' if it is not classified as 'Urban' as per the above definition. For Census 2011, the population of Others has been clubbed with the Males for working out population, 0-6 population, literates and related rates and Notes: The figures for India and Manipur, include by sex, the estimated population, 0-6 population and literates of Paomata, Mao Maram and Purul sub-divisions of Senapati district of Manipur for Census 2001 and 2011. For working out density of India and the State of Jammu & Kashmir, the entire area and population of those portions of Jammu & Kashmir which are under illegal occupation of Pakistan and China have not been taken into ProfileSource: Census of India 2011 Literacy rate, 7+ yrs Percent , 7+ yrs 11,777,201 18,328,069 7,646,857 10,882,519 4,130,344 7,445,550 05,000,00010,000,00015,000,00020,000, Rural Urban Total Rural Urban 7,703,730 12,643,078 5,238,836 7,682,731 2,464,894 4,960,347 05,000,00010,000,00015,000,00020012011 PersonsMalesFemales4,073,471 5,684,991 2,408,021 3,199,788 1,665,450 2,485,203 01,000,0002,000,0003,000,0004,000,0005,0 00,0006,000,00020012011 PersonsMalesFemales338 414 010020030040050020012011 Total Total941 948 962 961 870 910 5006007008009001,0001,10020012011 TotalRuralUrban965 948 973 957 930 908 5006007008009001,0001,10020012011 TotalRuralUrbanSex ratio Females per 1000 males Sex ratio, 0-6 yrs Females per 1000 males Population density Persons per sq km Number