Transcription of JUVENILE JUSTICE STATISTICS
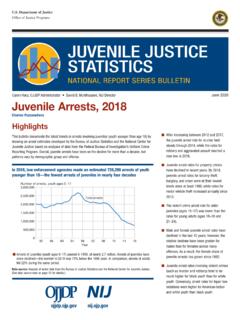
1 Department of JUSTICE Office of JUSTICE ProgramsJUVENILE JUSTICE STATISTICSNATIONAL REPORT SERIES BULLETINC hyrl Jones, OJJDP Acting Administrator Jennifer Scherer, NIJ Acting DirectorMay 2021 JUVENILE Arrests, 2019 Charles Puzzanchera Highlights This bulletin documents the latest trends in arrests involving juveniles (youth younger than age 18) by drawing on arrest estimates developed by the Bureau of JUSTICE STATISTICS and the National Center for JUVENILE JUSTICE based on analyses of data from the Federal Bureau of Investigation s Uniform Crime Reporting program. Overall, JUVENILE arrests have been on the decline for more than two decades, but patterns vary by demographic group and offense. In 2019, law enforcement agencies made an estimated 696,620 arrests of youth younger than 18 the fewest arrests of juveniles in nearly 4 decades Number of arrests, youth ages 0 17 3,000,000 2,500,000 2,000,000 1,500,000 1,000,000 500,000 0 Year n Arrests of juveniles (youth ages 0 17) peaked in 1996, at nearly million.
2 Arrests of juveniles have since declined the number in 2019 was 74% below the 1996 peak. In comparison, arrests of adults fell 24% during the same period. Data source: Analysis of arrest data from the Bureau of JUSTICE STATISTICS and the National Center for JUVENILE JUSTICE . (See data source note on page 13 for details.) Total arrests 80 8386 89 92 9598 01 04 0710 13 16 19 n After increasing in recent years, the JUVENILE arrest rate for murder fell 6% in the last year, and the rates for robbery and aggravated assault reached a new low in 2019. n JUVENILE arrest rates for property crimes have declined in recent years. By 2019, JUVENILE arrest rates for larceny-theft, burglary, and arson were at their lowest levels since at least 1980, while the rate for motor vehicle theft was above its 2013 low point.
3 N In 2019, the violent crime arrest rate for older juveniles (ages 15 17) was lower than the rates for young adults (ages 18 20 and 21 24). n Male and female JUVENILE arrest rates have declined in the last 10 years; however, the relative declines have been greater for males than for females across many offenses. As a result, the female share of JUVENILE arrests has grown since 1980. n JUVENILE arrest rates involving violent crimes (such as murder and robbery) tend to be much higher for black youth than for white youth. Conversely, arrest rates for liquor law violations were higher for American Indian and white youth than black youth. 2 National Report Series Bulletin The FBI s UCR Program provides data about JUVENILE arrests A Message From OJJDP and NIJ This bulletin summarizes recent trends in JUVENILE arrests in the United States based on data from the Federal Bureau of Investigation s Uniform Crime Reporting program.
4 The cumulative data in this bulletin reveal recent and long-term shifts in JUVENILE arrests based on offense, gender, and race. It is a useful tool for JUVENILE JUSTICE practitioners, researchers, policymakers, and others who seek to prevent, intervene in, and respond to JUVENILE delinquency. The number of arrests involving juveniles in 2019 was at its lowest level since at least 1980, and much of the decline has occurred in the past 10 years. Between 2010 and 2019, the number of JUVENILE arrests fell 58%. Among violent crimes, arrests for robbery declined 13% and arrests for aggravated assault declined 6% between 2015 and 2019, while arrests for murder increased 10%. In 2019, there were an estimated 83,690 JUVENILE arrests for larceny-theft. Four in 10 (40%) of these arrests involved females, 3 in 10 (30%) involved youth younger than 15, and more than half (55%) involved white youth.
5 Relative declines in arrests have been greater for boys than for girls across many offenses. As a result, the female share of JUVENILE arrests has grown since 1980. OJJDP and NIJ remain committed to supporting research, programs, and initiatives to combat JUVENILE delinquency and to provide positive outcomes for youth, their families, and their communities. Chyrl Jones OJJDP Acting Administrator Jennifer Scherer, NIJ Acting Director What do arrest STATISTICS count? Findings in this bulletin are drawn from data that local law enforcement agencies across the country report to the Federal Bureau of Investigation s (FBI s) Uniform Crime Reporting (UCR) program. To properly interpret the material presented, the reader needs a clear understanding of what arrest STATISTICS count.
6 Arrest STATISTICS report the number of arrests that law enforcement agencies made in a given year not the number of individuals arrested nor the number of crimes committed. The number of arrests is not the same as the number of people arrested because an unknown number of individuals are arrested more than once during the year. Nor do arrest STATISTICS represent the number of crimes that arrested individuals commit because a series of crimes that one person commits may culminate in a single arrest, and a single crime may result in the arrest of more than one person. This latter situation, where many arrests result from one crime, is relatively common in JUVENILE law-violating behavior because juveniles* are more likely than adults to commit crimes in groups.
7 For this reason, one should not use arrest STATISTICS to indicate the relative proportions of crime that juveniles and adults commit. Arrest STATISTICS are most appropriately a measure of entry into the JUSTICE system. Arrest STATISTICS also are limited in measuring the volume of arrests for a particular offense. Under the UCR program, the FBI requires law enforcement agencies to classify only the most serious offense charged in an arrest. For example, the arrest of a youth charged with aggravated assault and possession of a weapon would be reported to the FBI as an arrest for aggravated assault. Therefore, * In this bulletin, JUVENILE refers to persons younger than age 18. In 2019, this definition was at odds with the legal definition of juveniles in eight states seven states where all 17-year-olds are defined as adults, and one state where all 16- and 17-year-olds are defined as adults.
8 When arrest STATISTICS show that law enforcement agencies made an estimated 16,080 arrests of young people for weapons law violations in 2019, it means that a weapons law violation was the most serious charge in these arrests. An unknown number of additional arrests in 2019 included a weapons charge as a lesser offense. Crime in the United States Reports Data on murder Victims Each Crime in the United States report, published by the FBI, presents estimates of the number of crimes reported to law enforcement agencies. Although many crimes are never reported, murder is one crime that is nearly always reported. An estimated 16,425 murders were reported to law enforcement agencies in 2019, or murders for every 100,000 The murder rate was essentially constant between 1999 and 2006 and then fell 22% through 2014, reaching its lowest level since at least 1980.
9 The rate increased 19% through 2017 then fell 6% through 2019. Of all murder victims in 2019, 92% (or 15,065 victims) were 18 years old or older. The other 1,360 murder victims were younger than age 18 ( , juveniles). The number of JUVENILE murder victims declined 33% between 2007 and 2013, reaching its lowest level since at least 1980. After reaching that historic low, the number of JUVENILE murder victims increased 16% through 2017, declined 6% in 2018, and then increased 4% in the past year. As a result, the number of JUVENILE murder victims in 2019 was 13% above the 2013 low point and 53% below the 1993 peak, when an estimated 2,880 juveniles were murdered. Of all juveniles murdered in 2019, 32% were younger than age 5, 73% were male, 42% were white, and more than half (58%) were killed by a firearm.
10 May 2021 3 In 2019, law enforcement agencies in the United States made fewer than 700,000 arrests of persons younger than 18 2019 estimated number of JUVENILE arrests Percent of total JUVENILE arrests Percent change Most serious offense Female Younger than 15 White 2010 2019 2015 2019 2018 2019 Total 696,620 31% 32% 63% 58% 24% 4% Violent Crime* 44,010 21 30 49 40 8 5 murder and nonnegligent manslaughter 860 11 12 47 15 10 6 Rape* NA NA NA NA NA NA NA Robbery 16,080 12 22 36 41 13 7 Aggravated assault 27,070 26 35 56 40 6 3 Property Crime Index 119,790 33 30 55 67 43 9 Burglary 20,700 14 33 57 68 42 7 Larceny-theft 83,690 40 30 55 70 46 10 Motor vehicle theft 13,610 20 27 47 14 7 8 Arson 1,800 15 57 69 61 33 2 Nonindex Other (simple) assault 126,130 38 44 59 40 4 1 Forgery and counterfeiting 850 23 16 62 50 17 18 Fraud 3,690 33 25 50 36 18 22 Embezzlement 540 46 6 47 22 8 7 Stolen property (buying, receiving, possessing) 8,940 18 21 35 39 14 4 Vandalism 31,950 20 43 70 59 23 4 Weapons (carrying, possessing, etc.)