Transcription of JUVENILE JUSTICE STATISTICS
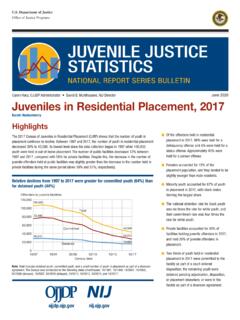
1 Department of JUSTICE Office of JUSTICE Programs Office of JUVENILE JUSTICE and Delinquency Prevention JUVENILE JUSTICE STATISTICSNATIONAL REPORT SERIES BULLETINC aren Harp, AdministratorApril 2019 53% 57% 43% 46% 44% 44% 47% 48% Youth arrests Delinquency cases Petitioned status cases Youth in placement 60% 50% 40% 30% 20% 10% 0% Percent change 2006 2015 Female Male 29% 27% 28% 27% 43% 43% 15% 15% Youth arrests Delinquency cases Petitioned status cases Youth in placement 0% 10% 20% 30% 40% 50% Female proportion 2015 2006 Girls in the JUVENILE JUSTICE System Samantha Ehrmann, Nina Hyland.
2 And Charles Puzzanchera Highlights This bulletin presents STATISTICS on girls in the JUVENILE JUSTICE system from three national data collections, covering their involvement from arrest through residential placement. It also provides an analysis of trends and case processing in addition to characteristics of the youth studied and their offenses. n Arrests involving girls decreased by morethan half (53%) between 2006 and 2015, reaching their lowest point in three Delinquency cases and petitioned statuscases involving girls also reached theirlowest points since the early 1990s, decreasing 43% and 44%, respectively, from 2006 through After falling 47% since 2006, the number offemales in placement in 2015 was at itslowest level since at least Since 2006, the proportion of femalesremained relatively constant for arrests, delinquency cases, petitioned status cases, and youth in Larceny-theft.
3 Simple assault, and disorderlyconduct accounted for 50% of arrests and56% of delinquency cases involving girls in2015. Truancy offenses accounted for morethan half (55%) of petitioned status offensecases involving females. n In 2015, delinquency cases involvinggirls were less likely to be petitioned, adjudicated, or result in out-of-homeplacement than cases involving recent years, the involvement of girls in the JUVENILE JUSTICE system declined at a rate similar to that for boys As a result, the proportion of females at various stages of the JUVENILE JUSTICE system has changed very little since the mid-2000s Access OJJDP publications online at 2 National Report Series Bulletin A Message From OJJDP The Office of JUVENILE JUSTICE and Delinquency Prevention (OJJDP)
4 Supported the statistical analyses reported in this bulletin to help the field better understand the nature of girls offending and how the JUSTICE system handles cases involving girls. The authors drew upon three national data collections the Federal Bureau of Investigation s Uniform Crime Reporting Program and OJJDP s National JUVENILE Court Data Archive and Census of Juveniles in Residential Placement to create a statistical portrait of girls in the JUVENILE JUSTICE system, including trends in the demographics of this population, the offenses they committed, and how they move through the system.
5 Both genders involvement in the JUVENILE JUSTICE system has declined at similar rates over the past decade. However, focusing on the overall trend may obscure important details. For example, although girls accounted for less than one-third of youth arrests in 2015, they made up a relatively large share for certain types of offenses, such as larceny-theft and liquor law violations. Additionally, 2015 data reveal that the offense profiles of petitioned status offense and delinquency cases involving younger girls differ from those of older girls.
6 The examination of these types of trends and characteristics of girls in the JUVENILE JUSTICE system is critical to assessing needs, identifying potential service gaps, and directing interventions for this population. OJJDP prepared this bulletin to help states, communities, and tribal jurisdictions understand the national trends and consider how they may use their own data to identify and target effective and cost-efficient strategies for girls. Caren Harp Administrator The latest data highlight trends and characteristics of girls in the JUVENILE JUSTICE system and the system s response to them Boys have always accounted for the majority of youth involved in the JUVENILE JUSTICE system.
7 Consequently, advancements in policy and practice tended to focus on males. As the number of female youth entering the JUVENILE JUSTICE system grew throughout the 1990s, policymakers and researchers shifted their attention to girls to better understand the reasons behind this In 2004, the Office of JUVENILE JUSTICE and Delinquency Prevention (OJJDP) established the Girls Study Group to examine what influences delinquent behavior among girls and how the JUVENILE JUSTICE system should respond. The group disseminated knowledge acquired from literature 1 Zahn, , Hawkins, , Chiancone, J.
8 , and Whitworth, A. 2008. The Girls Study Group Charting the Way to Delinquency Prevention for Girls. Girls Study Group series. Washington, DC: Department of JUSTICE , Office of JUSTICE Programs, Office of JUVENILE JUSTICE and Delinquency Prevention. Available at reviews, studies, and assessments through its bulletin series Understanding and Responding to Girls Delinquency. Today, OJJDP provides funds to support comprehensive, community-based services for girls in an effort to reduce violence and victimization and to promote public safety.
9 Research has revealed the various adversities many girls face as well as their unique responses to trauma that place them at risk for entering the system. This statistical bulletin presents a national portrait of girls involved with the JUVENILE JUSTICE system as assessed through three national data collections: the Federal Bureau of Investigation s (FBI s) Uniform Crime Reporting (UCR) Program, OJJDP s National JUVENILE Court Data Archive, and OJJDP s Census of Juveniles in Residential Placement. The bulletin examines recent trends of girls involved in the system and addresses their demographics, the offenses that led to their involvement, and how they move through the system.
10 April 20193 Females accounted for a small proportion of youth arrests for violent offenses in 2015 Most serious offense Female youth arrests, 2015 Female proportion Percent change 2006 2015 Total* 269,900 29% 53% Violent Crime Index Murder 100 6 30 Rape Robbery 2,000 11 40 Aggravated assault 7,300 26 48 Property Crime Index 70,700 34 45 Burglary 4,800 13 48 Larceny-theft 63,000 40 44 Motor vehicle theft 2,600 18 55 Arson 400 16 61 Simple assault 48,200 37 42 Fraud 1,500 33 41 Stolen property 1,700 16 45 Vandalism 7,000 17 55 Weapons violations 2,100 11 56 Prostitution and commercialized vice 400 76 61 Sex offenses Drug abuse violations 21,100 21 33 Offenses against child and family 1,300 37 39 Driving under the influence 1,600 25 65 Liquor law violations 17,200 40 66 Drunkenness 1,600 29 62 Disorderly conduct 25,100 35 64 All other offenses except traffic 46.