Transcription of Key-Findings
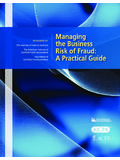
1 INTERNAL CONTROL WEAKNESSES. 2,690 $7 billion+. Median duration WERE RESPONSIBLE FOR NEARLY Owners/executives of a fraud scheme HALF OF FRAUDS accounted for IN TOTAL LOSSES a small percentage real cases of occupational fraud of cases Losses caused by men from $130,000 were 75% larger than losses caused by women 125 countries MEDIAN LOSS PER CASE. MONTHS 1. in 22% ALL 18 ANTI-FRAUD CONTROLS. ANALYZED WERE ASSOCIATED. median losses are far greater 23. OF CASES CAUSED 19% $$$$$$$. industry LOSSES OF. Corruption WITH LOWER FRAUD LOSSES of cases $74,000 when fraudsters categories collude $1 million+ AND QUICKER DETECTION. 2. was the most common scheme in every global region but caused a $$$$$$$$$$$$$$.
2 $150,000. median loss of Tips $850,000. 3+. are by far the most common . initial detection method $$$$$$$$$$$$$$$$$$$$$$$$$$$$$$. Asset Misappropriation schemes $800,000 $339,000. are the most common and least costly median loss . internal management $114,000. median loss 89%. tips 40%. audit 15%. review 13%. DATA MONITORING/ANALYSIS and SURPRISE AUDITS were correlated with the largest reductions in fraud loss and duration FRAUDSTERS WHO HAD BEEN. WITH THEIR COMPANY LONGER.. of cases employees Organizations with hotlines detect fraud by tips more often 52% Data monitoring/. analysis 58% STOLE TWICE AS MUCH. provide over half of tips, and nearly lower losses faster detection 85% MORE THAN 5 YEARS' TENURE.
3 $200,000.. 1/3 come from financial statement outside parties 46% of fraudsters fraud schemes OF CASES. 30%. 51% Surprise audits 54% MEDIAN LOSS. are the least common 10% DETECTED displayed at least of cases BY TIP OF CASES. and most costly DETECTED lower losses faster detection one behavioral LESS THAN 5 YEARS' TENURE. BY TIP. Yet only 37% of victim organizations red flag $100,000. of fraud MEDIAN LOSS. implemented these controls HOTLINES NO HOTLINES. Only 4%. Over the past 10 years, occupational fraud SMALL BUSINESSES referrals to prosecution declined 16%. LOST ALMOST. TWICE AS MUCH. PER SCHEME. TO FRAUD. $104,000. MEDIAN LOSS. $200,000 MEDIAN LOSS. TOP REASON FOR. NON-REFERRALS WAS.
4 OF PERPETRATORS. HAD A PRIOR. FRAUD CONVICTION. -16%. FEAR OF BAD. 100+ EMPLOYEES <100 EMPLOYEES PUBLICITY. A MAJORITY OF THE VICTIMS RECOVERED NOTHING. 2008 2009 2010 2011 2012 2013 2014 2015 2016 2017 2018.
