Transcription of KEY PERFORMANCE INDICATORS 6
1 DairyCHECK Farm Business Management Analysis1 Foreword2 WHAT is DairyCHECK?3 Farm Business Management Manual4 Introduction5 KEY PERFORMANCE INDICATORS6 Farm Checklist7 DairyCHECK Summary Sheet8 Review9 FARM LIQUIDITY AND PROFITABILITY10 Cash Flow Budget Summary13 Profit Analysis Summary14 PARTIAL BUDGETS15 Partial Budget Case Study 116 Partial Budget Case Study 217 BENCHMARKING AND COMPARATIVE ANALYSIS20 RISK MANAGEMENT21 APPENDIX 122 Cash Flow and Profit & Loss Calculations22 Balance Sheet25 Income Schedule X Livestock Inventory26 Income Schedule Y Feeds and Commodity27 Table of ContentsDairyCHECK Farm Business Management Analysis2
2 ForewordChange is occurring at a rapid rate in the NSW dairy industry due to the cost-price squeeze associated with reduced milk prices and increasing input farmers, wishing to stay in the industry are at the crossroads, having tomake decisions on the adoption of cost effective technology and how toenlarge their is difficult to speculate on future milk prices but the cost of production andliving expenses suggest that we will need to continually challenge existingherd sizes and levels of production per hectare and per prices suggest that gradual increases will not be the complete answerand productivity gains will have to be made at even faster rates and greateramounts than in the is estimated that we will have a shrinking industry when it comes to thenumber of farms but in terms of the production per farm and the
3 Adoption ofnew technology, dairying in NSW will be a growth will no doubt continue and there will be the need to increase theeffectiveness of existing operations to reduce costs. It will also be necessaryto consider ways to graze and milk larger herds to improve total farm will involve close examination of the key drivers of profit ie. herd, shed,feed, labour and farm AshwoodDairyCHECK :The DairyCHECK Planning Team and Regional Extension Teams appreciatethe support of the Dairy Industry Development Company (DIDCo) and theSub Tropical Dairy Program (SDP) and the funds provided by NSWA griculture and the Farmgate Deregulation Assistance also thank Bega Cooperative and Dairy Farmers for providing benchmarkinformation and Bird Cameron (Rural Management Services)
4 For theirguidance in analysing farm importantly, much appreciation is shown towards farmers and serviceproviders who have helped the development and implementation Farm Business Management Analysis3 WHAT IS DAIRYCHECK?DairyCHECK is about farmers selecting the most appropriate technology andmanagement to improve the overall profitability of their is based on a series of integrated technical packages and activities(eg. tutorials and workshops) to help farmers make better decisions during aperiod of rapid project comprises of three stages:Stage 1 Farm Management Audit - using a Checklist todetermine management opportunities for your farm by: Calculating the impact of deregulation on farm income Knowing the strengths and opportunities of your farm Identifying financial and physical key PERFORMANCE INDICATORS Examining ways to improve 2 Farm Business Management - using various tools andpackages to determine the best ways to optimise the use ofresources by.
5 Understanding the financial and physical PERFORMANCE of your farm Identifying your goals and needs Considering ways to be profitable Analysing farm profits and 3 Profitable Production System - using the most up-to-date knowledge and skills to develop and introduce new technologyand different production systems by: Examining different production scenarios Identifying and analysing cost effective technology Planning the implementation of different systems Analysing future options and alternatives to improve Farm Business Management Analysis4 FARM BUSINESS MANAGEMENT MANUALFarm Business Management analysis helps you to understand how your businessis performing and looks at ways to improve the profitability of the 1 of DairyCHECK - Farm Audit examined:- the impact of deregulation on the price of milk and farm income the key drivers of profit ie.
6 Feed, herd, farm, shed and labour management the management strengths and opportunities of your farm the management areas that needed changeStage 2 of DairyCHECK - builds on Stage 1 by:-Linking physical and financial INDICATORS Taking the complexity out of comparing PERFORMANCE INDICATORS Recognising that each farm and its management are unique Using PERFORMANCE INDICATORS to improve your businessIdentifying ways to improve farm profitability Determining the strengths and opportunities of your business Explaining what INDICATORS mean to your business Examining why certain INDICATORS need to changeAnalysing the present and future viability of your farm Determining the capacity of your farm to meet financial requirements Identifying if your business provides sufficient
7 Funds to meet your familyneeds Examining ways your business can generate additional incomeUsing tools to improve farm decisions Partial Budgets Cash Flow Budgets Comparative analysisThis self help manual is part of Stage 2 ie. Farm Business Management Analysisby:Andrew AlfordAlex AshwoodDick BuesnelLloyd DaviesTony DowmanCol GriffithsSTEP ONESTEP TWOSTEP THREESTEP FOURD airyCHECK Farm Business Management Analysis5 INTRODUCTIONA nalysing your business can be complex due to the number of factors involvedand the individuality of , key PERFORMANCE INDICATORS and financial tools can assist you toidentify management strengths and opportunities of your analysis helps you to examine ways to consider the combination of physicaland financial inputs to improve farm profitability and importantly.
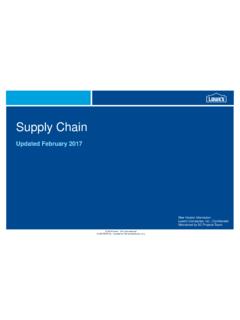
8 Farm analysis must fully consider your farm and family how your business is performing allows you to make betterdecisions to reach your family you know if yourfarm is profitable?NOYESIs your farm viable?NOYESWill you meet futurefinancial requirements?NOYESWill there be sufficient profitsto meet your family goals?NOYESGo toDairyCHECKS tage 2 FarmAnalysisGo toDairyCHECKT echnicalpackages Herd Feed Labour Shed FarmGREATNEWSWELLDONE ddddddddddddddddddddDairyCHECK Farm Business Management Analysis6 KEY PERFORMANCE INDICATORSAs shown in DairyCHECK Farm Audit (Stage 1) Key PERFORMANCE Indicatorscan help you determine the influence of technical and financial factors on yourprofits.
9 The various financial and technical INDICATORS used in DairyCHECK FarmAnalysis (Stage 2) can help identify the challenges and opportunities for yourfarm business. These PERFORMANCE INDICATORS may help to provide a betterknowledge of your business. Table 1 provides some typical values based uponcash flow, to compare your dairy farm business PERFORMANCE with. They arebased upon historical data up to 1999 1: Dairy Cash Flow Analysis GuidelinesCategoryTFR %1 Cents/L$/calver2$/ha3 Herd3-8% - - 180 Shed2-3% - Feed30-35%< - 800< 770 Total Variable Costs45%< < 1030 Gross Margin55% > 1250> 1210 Common Fixed Costs4-6%< 3.
10 0 LabourUp to 8%< 7 . 0 Repairs & Maintenance4-6% Total Fixed Costs15-20% Farm Operating Surplus35+% 1 TFR% = costs are expressed as a % of Total Farm Receipts;2 Calver = number of cows calved in the year;3 ha = the total dairy area (milking area and dry runs etc.). PERFORMANCE INDICATORS must not be used in isolation. Used in a whole-farmcontext they will help you to determine: the possible reason for high or low figures; areas that if changed would improve your profits; PERFORMANCE levels needed to improve is important to ask why a particular figure or ratio for your farm is high orlow.