Transcription of Key Performance Indicators - KPI’s
1 Training Pack Key Performance Indicators - KPI's Aims & Objectives Target Audience : Site Management to Team Leaders Purpose of Module :To ensure employees have the skills to quantify impact, and provide timely direction for an individuals contribution ( at all levels) towards achieving overall business goals Aims & Objectives : How to define & measure our given business goals Why have KPI's How clarity of objectives improves motivation and delivers Performance Standardised approaches to KPI's How to translate and cascade KPI's at all levels Explain links to Performance Management Key Performance Indicators Course Outline INTRODUCTION. WHAT ARE KEY Performance Indicators ? CHARACTERSITICS OF A GOOD KPI.
2 EXAMPLES OF KPI'S. THE KPI CASCADE PROCESS. HOW TO CREATE AND MANAGE KPI'S. SUMMARY. 3. Introductions Name Department Length of service Knowledge of Key Performance Indicators What are KPI's Flip Chart Key Performance Indicators WHAT ARE KPI's FOR? TO COMMUNICATE STATUS - ACTUAL v TARGET. PLANT LEVEL. BUSINESS LEVEL. WORK STATION LEVEL. TO DRIVE IMPROVEMENT BY FACT NOT GUESSWORK. TO HELP PRIORITISE IMPROVEMENT ACTIVITY. A CONTINUAL HEALTH CHECK FOR THE BUSINESS. TO CONNECT THE CUSTOMER TO THE PROCESS. Key Performance Indicators ESSENTIAL. IMPORTANT TO THE VIEWER. VITAL - AFFECTS THE BUSINESS. CUSTOMER FOCUSED. DRIVES IMPROVEMENT. Key Performance Indicators USEFUL. CURRENT - UP TO DATE. EASY TO UNDERSTAND.
3 IMPORTANT AND RELEVANT. VIEWER CAN CONTRIBUTE. HAS A STAKE. CAN HAVE AN EFFECT (good and bad). Key Performance Indicators IMMEDIATE. URGENCY / OWNERSHIP. RESPONSIBILITIES DEFINED. DYNAMIC IMPROVEMENT PLAN. AUDIT PROCESS - ACTUAL V's PLAN. CLEAR OBJECTIVES. Key Performance Indicators WHAT ARE KPI's NOT? GROUP OF METRICS. NOT EVERYTHING WE MEASURE IS A KPI ! STATISTICS. THESE CAN HELP DEFINE KPI's WORK MEASUREMENT. A TOOL FOR BLAME. WALL PAPER. Key Performance Indicators CHARACTERISTICS OF GOOD KPI. DYNAMIC. WELL MANAGED - ROTATE VITAL FEW. OWNED AND OPERATED BY LOCAL TEAM. SIMPLE. EASY TO UPDATE - MANUAL. VISUAL. LOCATED WHERE EASY TO SEE. CHANGES JUMP OUT AT VIEWER. ENGAGING. RELEVANT - CREATES TALKING POINT.
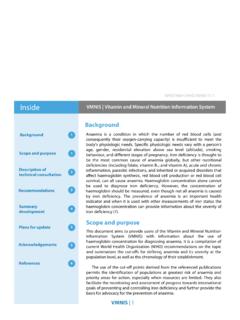
4 STANDARD FORMAT. EASY FOR OUTSIDER TO UNDERSTAND. FEEDBACK RECORDED AND ACTED UPON. Key Performance Indicators Business KPI's Safety Performance Quality Performance Cost Performance Delivery Performance People Performance Examples Actual Performance Plotted Against Target Defects Per Assembly Unambiguous Title Visual indicator 600 of 500 Performance Trend 400. 300. 200. 100. Legend Easy To understand 0. Jul Jul Mar May Jan Nov Sept Sep Nov Target Improvement Machining Sub Assy Assembly Test 2001 Target Examples RAG Colour Coding RED. Outside of target with no improvement or deteriorating trend. AMBER. Inside of target but with deteriorating trend. Outside of target but with improving trend. GREEN.
5 Inside of target with improving or level trend. Examples Scrap Cost 2004. 16000 80. YTD Scrap Cost: 14000 70. 12000 60. No. Of Items 10000 50. 8000 40. 6000 30. 4000 20. 2000 10. 0 0. JAN FEB MAR APR MAY JUN JUL AUG SEP OCT NOV DEC. Scrap Cost Scrapped Items Budget Examples How are we doingSchedule against the plan? 100% Are we on target? 90%. 80%. 70%. 60%. 50%. 40%. 30%. 20%. 10%. 0%. Stage 1 Stage 2 Stage 3. Examples External Supply Schedule Adherence What are we aiming for? 100%. 80%. 60%. 40%. 20%. 0%. 23 24 25 26 27 28 29 30 31 32 33. Supplier 1 Supplier 3 Supplier 5. Supplier 2 Supplier 4. Examples WIP. 9000 8000. 3. 7000. 6000. Stock Turns 2. '000. 5000. 4000 3000. 1. 2000. 1000. 0 0.
6 Nov 99 Jun 00 Sep 00 Oct 00 Nov 00 36951 37043. WIP Value Product A WIP Value Product B. WIP Budget Stock Turns Examples % TAKT ADHERENCE Hrs Achieved / Hrs Planned x 100. 130. 125. 120. 115. 110. 105. 100. 95. 90. 85. 80. 75. 70. 65. 60. 55. 50. 45. 40. 35. 30. 25. 20. 15. 10. 5. DAY. DATE. SHIFT. Examples Performance Management Cascade Step 1 - Team Leaders manage the Key Drivers of Performance Are we fully manned to complete the workpackages? Is overtime under control? Stage 1 Jig Board Are we hitting targets (Minutes to complete Operations)? Minutes to complete Op 1. Step 2 - Manager holds daily Team Leader review by Minutes to work package complete Op 2. Actions timely and focused Support given when needed Step 3 - Assembly Managers review Weekly Performance withManagers.
7 Cost accountability introduced. Focus on shift by shift Performance . Manhours (Shift B). 3,200. 3,000. 2,800. 2,600. 2,400. 2,200. 2,000. Jan Feb M ar A pr M ay Jun Jul A ug Sep Oc t Nov Dec &. Performance Management Cascade Step 4 - Head of Business reviews Weekly Performance Good informed Stg 01 Cost Per Set 90. debate Stg 01 Hours per Set 85. resulting from 4,500 80. 4,000. 18 0 Stg 01 Build 75. 1. 0. upward cascade 3,500. 70. 16 0. 65. of Team Leaders' 3,000. 14 0. 60. Performance 2,500. 12 0. 55. 50. 2,000. 45 ( ). 10 0. 1,500 40 ( ). Countermeasure 80. 1,000 Jan Feb M ar Apr M ay Jun Jul ( 0 Aug .6) Sep Oct Nov Dec plans if targets 60 500. P e r i od ( ). ( 1. 0 ). not being met 40 0. 1 3 5.
8 Direct 7 9 11 13 15. Indirect 17 19 21 23. NPO. ( 1. 2 ). 25 27 29. Disruptio YTD 9 10 11 12 13 14 15 16 17 18 19 20 21 22 23 24 25 26 27 28 29. Week V ar iA dded anc e t oV32. al ue 1 W eek Out OfWeek J i g V ar i ance t o 32. 1 Ref r esh T r ai ni ng Week DiAscr tupt Cumul at i v e uali on - E x t er nal Di sr upt i on - at Cumul I nti ver e nal B udget 32. 1 B udget For ecas t 32. For1ec Refasrt es h (Lean). Step 5 Senior Management Team reviews Monthly Performance Production Volume Senior level escalation plans. 350 2. Hours per Set 6, 500. 300. 1. 5. 1. 250. 250. 6, 000. Cost Per Set 0. 5. 5, 500 200. 0. 5, 000. 200 150. 4, 500 -0 . 5. 150 4, 000 100. -1. 3, 500 50 - 1. 5. 100. 3, 000. 0 -2.
9 2, 500. 50 J an Feb M ar A pr M ay Jun Jul A ug Sep Oc t Nov Dec 2, 000. & Period Variance ( ) Period Var J unJ an J ul Feb A ug Sep M ar A pr M ay 0. Cumulative ActualOc t Nov Dec Cumulative Jan Actual Feb M ar Disruption A pr Sep Oc t M ay Nov Dec J un J ul A ug Stage 1 Stage 2. Budget ( ) Stage 3. Forecast FAL. Di ti OBP. Performance Management Cascade Step 6 - Site Cost Performance consolidated. Manufacturing Director reviews Factory Manager Performance . Forecasts of cost Performance compiled to ensure corrective actions taken to achieve Budget . Risks & Opportunities monitoring and control. Summ ary - All Categories 200, 000,000 1, 500,000. 180, 000,000. 1, 000,000. 160, 000,000. 140, 000,000.
10 500, 000. 120, 000,000. 100, 000,000 0. 80, 000,000. -500,000. 60, 000,000. 40, 000,000. -1,000, 000. 20, 000,000. 0 -1,500, 000. M onthly +/1 Forecast +/- to budget Cumulative actual Cumulative budget Cumulative forecast &. What KPI's do you think would be applicable to your area Flip Chart How to Create and Manage KPI's Identify Monitor Progress Customers Determine To Plan And Take and Suppliers Performance Corrective Action Drivers1. Form Improvement Form Team Teams ACT PLAN. Create Define Local Improvement Continuous Performance Improvement Plan Cycle Indicators CHECK DO. Score & Prioritise KEY. Collect Data Performance Indicators Train Users Identify owners Develop Format and users And Review Process How to Create and Manage KPI's Identify Customers Determine and Suppliers Performance Drivers Form Team Define Local Performance Indicators Score & Prioritise KEY.