Transcription of KEY TOOLS FOR HEDGING AND TAIL RISK MANAGEMENT
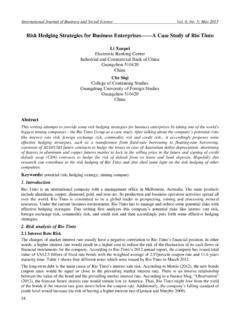
1 Asset Consultin g Group 23 1 South Bemis ton Avenue, 14 th Floor Saint Louis, Mis souri 63105 31 4 862 484 8 1 EXECUTIVE SUMMARY OF KEY HIGHLIGHTSTail Ris k in th e Past 25 Year s: Since mid-1986 the worst monthly declines for select indexes include: down 28 .2% for the S&P GSCI Index, down for S&P 500, down 20 .2% fo r MSCI EAFE, and a decline of only for th e CLL Index (Exhibit B). Tail Risk and Diversification in 2008: Changes for indexes in 20 08 - S&P 500 down ; two indexes with options and stocks - CLLSM down and VXTHSM down ; three fu tures-based indexes (with no stock positions) -- VXMT, DyVX and VTRsk, respectively inc re ase d 83 .9%, and 17 (E xh ibi t A). Lower Volatility: The CLL has incurred about 70% of th e vo latility of the S&P 500 over the last 26 years.
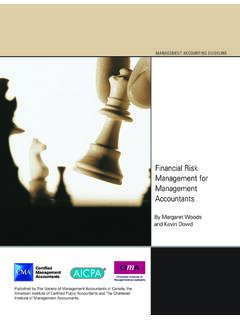
2 Select portfolios with the VXTH and the fu ture-based indexes have had less volatility than th e S&P 500 over the last 70 months (Exhibits C, F, and O). Exhibit A: Benchmar k Indexes Exhibit B: Histogram with Frequency of Monthly Returns for CLL and S&P 50 0 (July 1986 - January 2012) BENCHMARK INDEXES COLLAR OVER MORE THAN 25 YEARS Exhibit B: Since mid-1986 the worst monthly declines fo r select indexes in cl ude: down for the S&P GSCI Index, down for S&P 500, down 20 .2% fo r MSCI EAFE, down for BXM, and a de cline of only for CLL Index. Exhibit C: Returns and Volatility (J uly 1986 Ja nuary 2012)Exhibit C: The po rtfolio with an allocation of 20 % BXM an d 80% S&P 500 ha d a return of and standa rd deviation of 14 .8 %. For more analysis, please see ou r January Enhanced Returns fo r Portfolios : Portfolios with small al locati ons to the fu tures-based indices and th e VXTH had high er returns (and lower volatility) th an the S&P 500.
3 The annualized returns over th e past 70 months were for th e S for a portfolio of 20% VXTH and 80% S and for a portfolio of 10 % VTRsk (or 10 % DyVX) and 90% S&P 500 (Exhibits I and O). Higher Risk-adjusted Returns: Certain portfolios with th e VXTH and the fu ture-based indexes have had a higher Sortino Ratio th an key stock indices over the last 70 months (Exhibits F and L).This ar ticle an alyzes fiv e benchmarks that are designed to provide protection during declining equity markets (visit and for more details). Sources for all Exhibits on this page: Bl oomberg, Ib botson, ACG. 1111026731245911100000124103137402000020 406080100120140-24% - -20%-20% - -16%-16% - -12% -12% - -8% -8% - -4% -4% - 0% 0% - 4% 4% - 8% 8% - 12% 12% - 16% 16% - 20% 20% - 24%S&P 500 CLLCLL had only 1 month with losses of 8% or below.
4 10% BXM20% BXM10% CLL20% CLLS&P 500 MSCI EAFER ussell 2000S&P GSCI6%7%8%9%10%12%14%16%18%20%22%Standar d DeviationAnnualized Return FEBRUARY 2012 KEY TOOLS FOR HEDGING AND TAIL RISK MANAGEMENT Ticker (B loomberg)Options or Futures Position(s)Hold stocks?Price History Begins2008200920102011 CLL <Index>Buys three-month out-of-the-money S&P 500 put options at 95% of the S&P 500 value. Sells one-month out-of-the-money S&P 500 call options at 110% of the S&P 500 500 June <Index>Buys one-month 30-delta VIX call options. The weight of the VIX calls in the portfolio varies at each roll depending on the perceived likelihood that a "black swan" event could occur in the near 500 March <Index>Buys a combination of VIX futures positions in order to reflect the expectations of the VIX Index level in 5 months. Some of the VIX futures are rolled daily in order to maintain a constant average weighted five-month stocksDec.
5 <Index>Buys a combination of VIX futures positions in order to reflect dynamic allocation between the S&P 500 Short-Term VIX Futures Index and S&P 500 Mid-Term VIX Futures Index. The rules-based allocation is done with the goal of aiming to lower the roll cost of investments linked to future implied volatility. No stocksDec. <Index>Calculated using a weight of 45% of 2x the S&P VIX Short-Term Futures Index and 55% of the Inverse S&P 500 Short-Term Futures Index. The goal of the index is to provide a long volatility exposure whose cost is partially or completely mitigated (due to negative roll yield) via a rebalanced short stocksDec. <Index>NoneS&P 500 Jan. % Retu rn CBOE S&P 500 95-110 Collar Index ( CLL)CBOE VIX Tail Hedge Index (VXTH)S&P 500 VIX Mid-term Futures Index ( VXMT)S&P 500 Dynamic VIX Futures Index (DyVX)S&P 500 VIX Futures Tail Risk Index - Short Term (VTRsk)S&P 500 Index (Total Return)2012 paper on index option writing at Consul ting Group 231 South Bemiston Avenue, 14th Floor Saint L oui s, Missouri 63105 314 862 4848 2 Exhibit D: Growth of $1 for VXTH, CLL and S&P 500 Indexes (A pril 2006 - January 2012) Exhibit E: Histogram with Monthly Returns for VXTH and S&P 500 Index es (A pril 2006 - January 2012) Exhibit F: Metrics for Returns, Risk, and Risk-adju sted Returns (A pril 2006 - January 2012) Exhibit G.
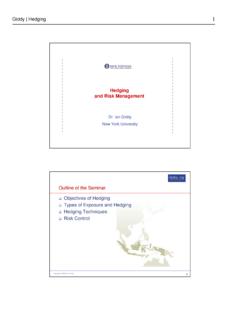
6 Changes for 5 In dexes in Months in Which S&P 500 had Bi g Moves (More than ) (April 2006 - January 2012) Exhibit H: Over - Under Chart with Returns Relative to S&P 500 ( April 2006 - January 2012) Exhibit I: Return and Volatility (April 2006 - January 2012) TAIL RISK AND OPTIONS-BASED INDEXES - VXTH AND CLL (April 2006 - Ja nua ry 2012 ) Exhibit D: The growth in the value of a dollar invested on March 31 , 2006. The VXTH has outperformed the S&P 500 since inception. Exhibit F: The VXTH index had ri sk-adjusted performance th at was superior to that of the S&P 500 per metrics such as the Sortino Ratio, Sharpe Ratio and Jensen s Alpha. Please no te that th e above indices ha d negativ e skewness, and the measur es of risk-adjusted returns are imperfect when measuring non-normal di str ibutions.
7 Exhibit H: The CLL cu shion du ring de clines is cl ear and compelling while the upside participation is somewhat moderated based on the underlying option ex posures. Exhibit I: The portfolio with an alloca ti on of 20% VXTH and 80% S&P 500 had a return of and standa rd deviation of 16 .4 %. Exhibit E: Since April 2006 the VXTH had only 9 months with losses of 4% or below versus 13 months for the S&P 500. Conv ersely, the VXTH participated in 42 of the 43 positiv e months indicating upside pa rti cipation as well as cushioning de clines. Exhibit G: The CLL and the VXTH pr ov ided a cu shion during the worst three months for the S&P 500 an d MSCI EAFE since April, 2006. The trade-off is reduced upside participation in the three be st months. Sources for all Exhibits on this page: Bl oomberg, Ib botson, ACG.
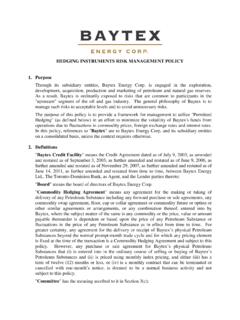
8 CLL $ VXTH $ S&P 500 $ $ $ $ $ $ $ $ $ $ 06 Jan -07 Nov-07 Sep -08 Jul-09 May-10 Mar- 11 Jan -120104814309400000036192994000051015202 5303540-2 4% - -2 0%-2 0% - -1 6%-1 6% - -1 2% -12% - -8% -8 % - -4% -4% - 0% 0% - 4% 4% - 8% 8% - 12% 12% - 16% 16% - 20% 20% - 24%S&P 500 VXTHThe worst monthly declines were down for S&P 500 and down fo r VXTH. Oct 2008-1 .8% 2009-1 .1% .4% 500 MSCI EAFES&P GSCI-20-15-10-505101520-25-20-15-10-5051 0152025S&P 500 CLL VXTHCLLVXTH In the 4th quarter, 2008, the VXTH increased versus a decline of 22 % for the S&P 500. April 2006 - January 2012% dard %21 .41%26 .46% .50%Beta vs. rpe ard Deviation13 .5%16 .1%20 .3% Ratio (MAR=Cash Eq.) 's Alph a vs. S&P % % % elation to S&P 50 500 MSCI EAFES&P GSCICLL10 % VXTH20 % VXTH10 % CLL20% CLLS&P 500 MSCI EAFER ussell 200 0-1%0%1%2%3%4%14%16%18%20%22%24%Standard DeviationAnnuali zed Retu rn FEBRUARY 2012 KEY TOOLS FOR HEDGING AND TAIL RISK MANAGEMENT Asset Consul ting Group 231 South Bemiston Avenue, 14th Floor Saint L oui s, Missouri 63105 314 862 4848 3 Exhibit J: Growth of $1 for VXMT, DyVX, VTRsk and S&P 500 Indexes (March 31, 2006 Jan uary 31, 2012) Exhibit K: Correlations o f Weekly Changes for Select Indexes (A pril 7, 2006 - F eb rua ry 3, 2012 ) Exhibit N: Over Under Chart with Returns Relative to S&P 500 (April 2006 January 2012 ) Exhibit M: Changes for 5 In dexes in Months in Which S&P 500 had Big Moves (More Than ) (April 2006 January 20 12) Exhibit L.
9 Metrics for Returns, Risk, and Risk-adju sted Returns (April 2006 Jan uary 2012) Exhibit O: Returns and Volatility (April 2006 January 2012) DIVERSIFICATION AND VIX FUTURES INDEXES - VXMT, DyVX, AND VTRsk (April 2006 - January 2012)Exhibit N: Allocatin g 10% to the VTRsk an d DyVX provided cushion during declines while also participating in ri sing markets. Exhibit L: A 10% allocatio n to the futu res-base d indice s had ri sk-adjusted pe rformance that was superior to that of the S&P 50 0 per metri cs su ch as the Sor tino Ratio, Sharpe Ratio an d Jensen s Alpha. Please note that the measures of risk-adjusted returns are imperfect when measuring non-normal distrib utions with negative skewness. Exhibit O: The portfolio with an allocation of 10 % VTRsk and 90% S&P 500 had a return of and st an dard deviat ion of 13.
10 4%. Exhibit J: The three futures-based indices added value due to the fa ct that they all rose more than 80 % in 2008 (see also th e annual return s table Exhibit A). Sources for all Exhibits on this page: Bl oomberg, Ib botson, ACG. S&P 50 0 VIX (Spo t)VXMTDyVXVTRskCLLVXTHMSCI EAFES&P GSCI S&P 50 (Spo t) GSCI K: The CLL and VXTH have a high co rrelation to the S&P 500 due to their st ock ex posure. All of the futures-base d indice s ar e negat ivel y correlated to the st ock indexes. Exhibit M: The fut ures-base d indices realized significant increase s du ring Sept ember and October 2008. Conversely, they experienced double- digit declines du rin g October 2011, a month when the S&P 500 rose 10 .9%. VXMT $ DyVX $ VTRsk $ S&P 500 $ $0 .00$1 .00$2 .00$3 .00$4.