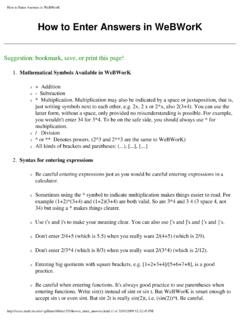
Transcription of Lab Project 2: Using R to simulate experiments
1 Lab Project 2: Using R to simulate experimentsCourse :Introduction to Probability and Statistics, Math 113 Section 3234 Instructor:Abhijit ChampanerkarDate:Oct 17th 2012 Tossing a coinThe probability of getting a Heads or a Tails on a coin toss is both We can useRtosimulate an experiment of flipping a coin a number of times and compare our results withthe theoretical probability. First let fix the convention:0 = Tails and 1 = HeadsWe can use the following command to tellRto flip a coin 15 times:> sample(0:1,15,rep=T)[1] 1 1 0 1 0 1 1 1 0 0 0 1 1 1 0 This gives 6 Tails and 9 heads. In fact we can write a function to flip a coinntimes:> FlipCoin = function(n) sample(0:1,n,rep=T)> e1=FlipCoin(30)> e1[1] 0 1 1 0 1 1 0 1 0 1 1 1 0 0 1 0 1 0 1 1 1 1 0 1 0 0 0 0 0 1 Now we can use thesumcommand to compare the results from this experiment to thetheoretical probabilities.
2 For example in the above experiment of flipping a coin 30 times,we can count the heads and tails as:> sum(e1==0)[1] 14> sum(e1==0)/30[1] > sum(e1==1)[1] 16> sum(e1==1)/30[1] gives us 14 Tails and 16 Heads. The probability or relative frequency of a Tail in thisexperiment is and a Head is that you may get different can plot arelativehistogram Using the command:> hist(e1,breaks=c( , , ), prob=T)1 Questions1. UseRto simulate an experiment of tossing a coin 100 times. Print the relativehistogram as above with your your name on Find the relative frequency of a Tail and Head in your experiment and fill in the tableon the next Repeat 2 for tossing a coin 500 times (do not print histogram).
3 Rolling diceThe probability of getting a number between 1 to 6 on a roll of a die is 1/6 = above we can useRto simulate an experiment of rolling a die a number of times andcompare our results with the theoretical probability. We can use the following commandto tellRto roll a die 20 times:> sample(1:6,20,rep=T)[1] 3 3 4 1 1 2 2 5 1 2 4 4 3 2 1 5 2 6 5 2As before we can write a function to roll a dientimes:> RollDie = function(n) sample(1:6,n,rep=T)> d1=RollDie(50)> d1[1] 3 4 5 5 6 5 1 6 3 3 1 3 5 4 4 3 2 1 5 2 1 1 2 2 3 1 6 2 6 1 5 1 4 1 4 4 4 6[39] 2 1 5 5 2 6 1 3 6 3 1 6 Now we can use thesumcommand to compare the results from this experiment to thetheoretical probabilities.
4 For example in the above experiment the number of 3 s and itsrelative frequency is:> sum(d1==3)[1] 8> sum(d1==3)/50[1] number 3 occurs 8 times and its relative frequency is which is quite close to 1 that you may get different answers. We can plot arelativehistogram usingthe command:> hist(d1,breaks=c( , , , , , , ), prob=T)2 Questions1. UseRto simulate an experiment of rolling a die 200 times. Print the relative his-togram and write your name on Find the relative frequency of the numbers 1 to 6 in your experiment and fill in thetable on the next Repeat 2 for rolling a die 1000 times (do not print histogram).
5 To Hand inFill in the next sheet with answers to above questions and hand it in along with onehistograms each for coin toss and rolling a die with youor name on Project 2 Please write your name, fill in the values, tear off and hand to :Coin Toss100 tosses500 tossesRelative Frequency of HeadsRelative Frequency of TailsRolling Dice200 rolls1000 rollsRelative Frequency of 1 Relative Frequency of 2 Relative Frequency of 3 Relative Frequency of 4 Relative Frequency of 5 Relative Frequency of 64